January 16, 2026 a 06:44 am
HUBB: Fibonacci Analysis - Hubbell Incorporated
Hubbell Incorporated has shown impressive growth, continuing its dominance in the electrical and utility solutions market. An uptrend has been identified in recent months, providing a solid basis for technical analysis. With a strong presence in North America and globally, Hubbell remains a key player in its industry. Investors might find the current analysis advantageous to recognize potential buying or selling opportunities.
Fibonacci Analysis
| Aspect | Details |
|---|---|
| Start Date | 2025-05-09 |
| End Date | 2026-01-15 |
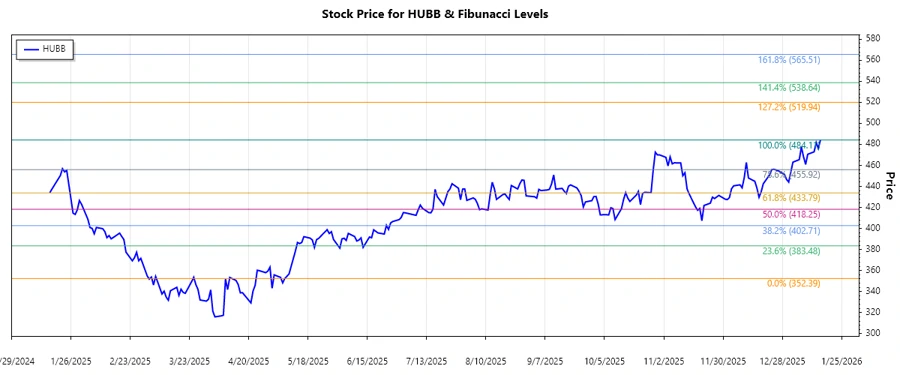
| High Price (Date) | $484.11 (2026-01-15) |
| Low Price (Date) | $352.39 (2025-05-07) |
| Fibonacci Level | Price Level |
|---|---|
| 0.236 | $416.89 |
| 0.382 | $442.10 |
| 0.5 | $464.25 |
| 0.618 | $486.40 |
| 0.786 | $514.40 |
The current price is at $484.11, which places it in the 0.618 Fibonacci retracement zone. This level could act as a significant resistance.
Conclusion
Hubbell Incorporated's recent upward trend suggests a strong momentum, with the stock currently testing the 0.618 Fibonacci level, which may serve as a crucial resistance point. Breaking above this level could suggest further upside potential, while failing to do so may result in a retracement to lower Fibonacci levels. Investors should watch out for potential consolidation or reversal signals at this level. With its solid market position and diverse portfolio, Hubbell remains a stable investment. However, market conditions and external factors should be monitored closely.