October 13, 2025 a 09:03 am

HSY: Trend and Support & Resistance Analysis - The Hershey Company
The Hershey Company's stock demonstrates notable movements, reflecting its established presence in the confectionery industry. An analysis of trendlines and support and resistance levels can provide valuable insights for potential investors. Additionally, understanding the recent price actions and trend can aid in making informed decisions concerning the stock's technical performance.
Trend Analysis
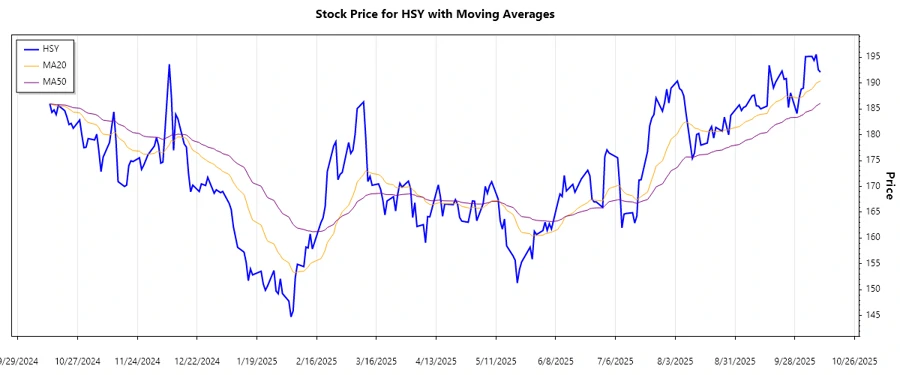
The following table identifies the EMA calculations over the recent period:
| Date | Close Price | Trend |
|---|---|---|
| 2025-10-10 | 192.13 | ▲ |
| 2025-10-09 | 192.58 | ▲ |
| 2025-10-08 | 195.56 | ▲ |
| 2025-10-07 | 194.39 | ▲ |
| 2025-10-06 | 195.18 | ▲ |
| 2025-10-03 | 195.13 | ▲ |
| 2025-10-02 | 189.02 | ▲ |
The trend observed is predominantly upwards as indicated by the EMA20 crossing above the EMA50. This reflects a bullish sentiment over the short to mid-term period.
Support and Resistance
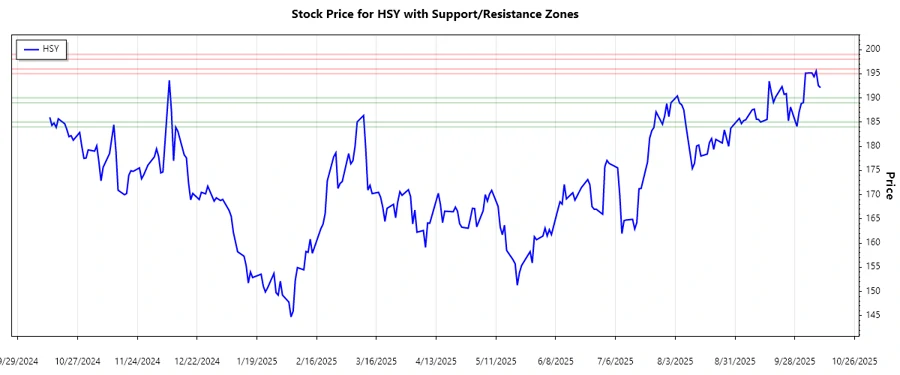
Key support and resistance levels calculated from historical price data are shown below:
| Zone Type | From | To |
|---|---|---|
| Support 1 | ▲ 184.00 | ▲ 185.00 |
| Support 2 | ▲ 189.00 | ▲ 190.00 |
| Resistance 1 | ▼ 195.00 | ▼ 196.00 |
| Resistance 2 | ▼ 198.00 | ▼ 199.00 |
The current price is approaching the resistance zone at considerable strength, suggesting a potential breakout opportunity or a pullback depending on market conditions.
Conclusion
The Hershey Company's stock is demonstrating a short-term bullish trend with its current price action crossing into key resistance zones. While this signals potential growth opportunities, investors should be cautious of market volatility and possible pullbacks. Monitoring support levels closely can help in managing risks and optimizing entry points. For financial analysts, these insights provide foundational data for strategic decision-making and forecasting.
Smart Data Insight
Master the Perfect Entry & Exit for this Stock
Don't leave your profits to chance. Historically, this stock follows specific seasonal patterns that institutional traders use to maximize returns.
- ✅ Identify the "Golden Buying Window"
- ✅ Avoid high-risk correction cycles
- ✅ Backtested data from the last 20+ years