November 22, 2025 a 10:15 am

HSY: Fibonacci Analysis - The Hershey Company
The Hershey Company stock, represented by the ticker HSY, has shown a strong technical behavior recently. With its vast portfolio of chocolate and non-chocolate products, it remains a dominant force in the confectionery space. Investors have witnessed fluctuations, however, the stock has recently entered a dominant downtrend. Understanding these trends can help investors in making informed decisions.
Fibonacci Analysis
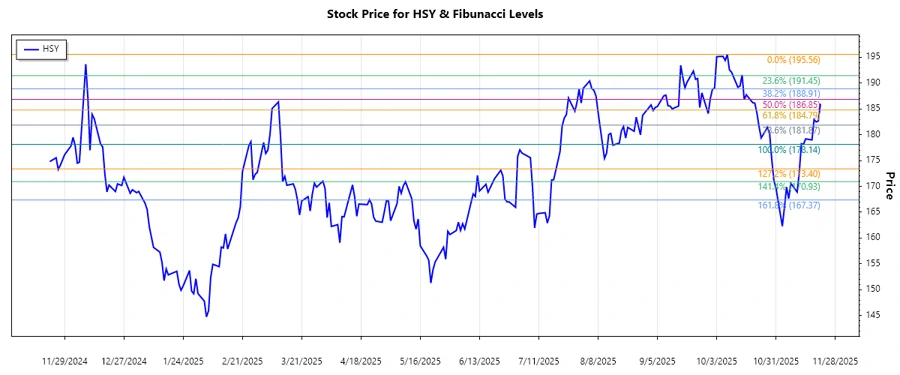
The Hershey Company (HSY) stock has recently experienced a dominant downtrend, beginning from early October 2025 to late November 2025. Using the highest price point on October 8, 2025, at $195.56 and the lowest price point on November 13, 2025, at $178.14, we can calculate the Fibonacci retracement levels. The recent trend suggests potential areas of support and resistance.
| Start Date | End Date | High Price & Date | Low Price & Date | Current Price |
|---|---|---|---|---|
| 2025-10-08 | 2025-11-13 | $195.56 (2025-10-08) | $178.14 (2025-11-13) | $186.00 (2025-11-21) |
| Fibonacci Level | Price |
|---|---|
| 0.236 | $190.94 |
| 0.382 | $188.35 |
| 0.5 | $186.85 |
| 0.618 | $185.34 |
| 0.786 | $183.25 |
The current price of $186.00 is located between the 0.382 ($188.35) and 0.5 ($186.85) retracement levels, indicating that the stock is potentially testing a key resistance area.
Conclusion
The Hershey Company's stock is at a crucial technical juncture as it navigates its recent downtrend. The current price lies between the 38.2% and 50% Fibonacci retracement levels, suggesting a possible resistance point. Investors should monitor closely for a break above or bounce back from these levels, as these movements might signal potential entry or exit points. While the stock faces pressures, the company's product diversification adds a layer of resilience. However, traders should remain vigilant of market volatility and economic conditions that could influence consumer behavior. The technical setup presents both opportunities and risks, calling for cautious but calculated investing strategies.
Smart Data Insight
Master the Perfect Entry & Exit for this Stock
Don't leave your profits to chance. Historically, this stock follows specific seasonal patterns that institutional traders use to maximize returns.
- ✅ Identify the "Golden Buying Window"
- ✅ Avoid high-risk correction cycles
- ✅ Backtested data from the last 20+ years