
May 07, 2026 a 11:31 am
HSY: Dividend Analysis - The Hershey Company
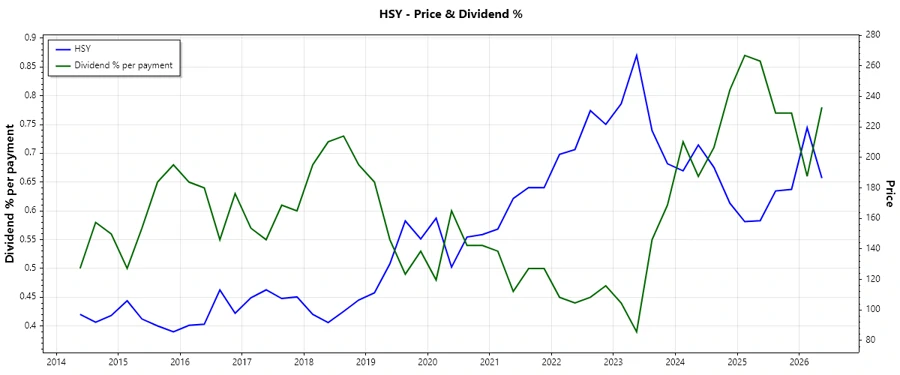
The Hershey Company showcases a robust dividend profile, marked by a consistent 42-year history of dividend payments, indicative of its commitment to delivering shareholder value. With a current dividend yield of 3.03% and a steady 5-year growth rate, Hershey’s approach to returning capital remains strong despite high EPS payout ratios. Their financial metrics require close examination, particularly their leverage ratios, to gauge long-term sustainability. As an established company, Hershey continues to present dividend investors with notable income opportunities.
📊 Overview
The Hershey Company operates within the Consumer Staples sector, offering a consistent dividend profile that appeals to income-focused investors. The company's commitment to returning cash to shareholders is evident with its stable dividend yield.
| Metric | Data |
|---|---|
| Sector | Consumer Staples |
| Dividend Yield | 3.03% |
| Current Dividend Per Share | 5.33 USD |
| Dividend History | 42 years |
| Last Cut or Suspension | None |
🗣️ Dividend History
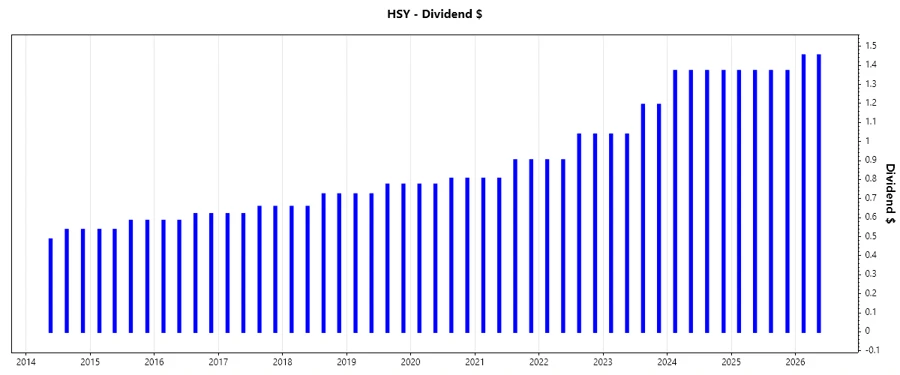
With a distinguished track record of 42 years of uninterrupted dividends, The Hershey Company demonstrates a solid commitment to shareholder returns. This extensive history signifies stability and reliability in dividend disbursements, which is crucial for long-term income investors. Understanding past performance helps investors predict future resilience.
| Year | Dividend Per Share (USD) |
|---|---|
| 2026 | 2.904 |
| 2025 | 5.48 |
| 2024 | 5.48 |
| 2023 | 4.456 |
| 2022 | 3.874 |
📈 Dividend Growth
The Hershey Company's dividend growth metrics provide a glimpse into its capacity to enhance shareholder returns. A healthy dividend growth rate over several years indicates the potential for increasing income.
| Time | Growth |
|---|---|
| 3 years | 0.12% |
| 5 years | 0.12% |
The average dividend growth is 11.68% over 5 years. This shows moderate but steady dividend growth.
📉 Payout Ratio
Payout ratios are critical indicators of dividend sustainability. Hershey's payout ratios suggest that a significant portion of earnings and cash flows are directed towards dividends, highlighting the firm's aggressive payout policy.
| Key Figure | Ratio |
|---|---|
| EPS-based | 96.84% |
| Free Cash Flow-based | 49.88% |
The EPS-based payout ratio of 96.84% suggests a high proportion of earnings being paid out as dividends, while a 49.88% FCF payout ratio indicates a more manageable cash flow coverage.
✅ Cashflow & Capital Efficiency
The analysis of cash flows and capital efficiency metrics can reveal insights into a company's operational capabilities and capital utilization efficiency, which are fundamental for sustaining dividend payments.
| Metric | 2023 | 2024 | 2025 |
|---|---|---|---|
| Free Cash Flow Yield | 4.07% | 5.60% | 4.72% |
| Earnings Yield | 4.88% | 6.46% | 2.39% |
| CAPEX to Operating Cash Flow | 33.19% | 23.94% | 23.19% |
| Stock-based Compensation to Revenue | 0.73% | 0.40% | 0.56% |
| Free Cash Flow / Operating Cash Flow Ratio | 66.81% | 76.06% | 76.81% |
The cash flow metrics reflect a strong foundation for continuous dividend payments. The company's ability to efficiently manage capital and generate consistent cash inflows is pivotal for sustaining long-term dividend growth.
⚠️ Balance Sheet & Leverage Analysis
A comprehensive understanding of leverage metrics is necessary to evaluate financial stability and the potential impact on dividend policies. Monitoring the debt levels and leverage ratios is vital to assess the company’s long-term financial health.
| Metric | 2023 | 2024 | 2025 |
|---|---|---|---|
| Debt-to-Equity | 125.04% | 115.55% | 116.53% |
| Debt-to-Assets | 43.06% | 42.08% | 39.32% |
| Debt-to-Capital | 55.56% | 53.61% | 53.82% |
| Net Debt to EBITDA | 1.72 | 1.52 | 3.09 |
| Current Ratio | 0.97 | 0.96 | 1.19 |
| Quick Ratio | 0.52 | 0.64 | 0.72 |
| Financial Leverage | 2.90 | 2.75 | 2.96 |
Hershey's leverage metrics show a well-maintained balance sheet with a balanced approach to debt management. The ratios reflect a solid capability to handle financial obligations without straining operations.
✅ Fundamental Strength & Profitability
Profitability metrics such as return on equity and margins are crucial in assessing how efficiently a company is able to convert its revenues into profit, offering insights into operational effectiveness and shareholder value.
| Metric | 2023 | 2024 | 2025 |
|---|---|---|---|
| Return on Equity | 45.42% | 47.11% | 19.05% |
| Return on Assets | 15.64% | 17.16% | 6.43% |
| Net Profit Margin | 16.68% | 19.83% | 7.55% |
| EBIT Margin | 20.90% | 23.64% | 12.39% |
| EBITDA Margin | 24.66% | 27.70% | 12.39% |
| Gross Margin | 44.76% | 47.32% | 33.27% |
| R&D to Revenue | - | - | - |
Overall, Hershey demonstrates strong profitability metrics, with considerable returns on equity and solid margins, underpinning its ability to generate sustained profitability and solidifying its dividend policy.
📈 Price Development
📊 Dividend Scoring System
| Criteria | Score | Score Bar |
|---|---|---|
| Dividend Yield | 3 | |
| Dividend Stability | 5 | |
| Dividend Growth | 4 | |
| Payout Ratio | 2 | |
| Financial Stability | 4 | |
| Dividend Continuity | 5 | |
| Cashflow Coverage | 4 | |
| Balance Sheet Quality | 4 |
Total Score: 31/40
✅ Rating
The Hershey Company's dividend profile showcases a strong commitment to shareholders despite a high payout ratio. The firm's historical reliability and consistent returns bolster its position in the market for income-seeking investors. Given the strength in profitability and a strategic approach to capital management, the recommendation leans towards an optimistic "Buy" for those prioritizing dividend stability combined with moderate growth potential.
Smart Data Insight
Master the Perfect Entry & Exit for this Stock
Don't leave your profits to chance. Historically, this stock follows specific seasonal patterns that institutional traders use to maximize returns.
- ✅ Identify the "Golden Buying Window"
- ✅ Avoid high-risk correction cycles
- ✅ Backtested data from the last 20+ years