November 07, 2025 a 03:31 am
HSY: Dividend Analysis - The Hershey Company
The Hershey Company showcases a robust dividend profile backed by consistent growth and industry-leading stability. Given its 41-year streak of uninterrupted dividends, Hershey stands as a testament to dividend reliability. Furthermore, its strategic financial management enhances its reputation as a solid investment, with no dividend cuts since 1991.
📊 Overview
As a key player in the confectionery sector, Hershey's dividend yield of 3.27% reflects a competitive edge. With dividends consistently paid over four decades, and a last cut in 1991, the company underlines its commitment to shareholders.
| Detail | Value |
|---|---|
| Sector | Confectionery |
| Dividend yield | 3.27% |
| Current dividend per share | 5.34 USD |
| Dividend history | 41 years |
| Last cut or suspension | 1991 |
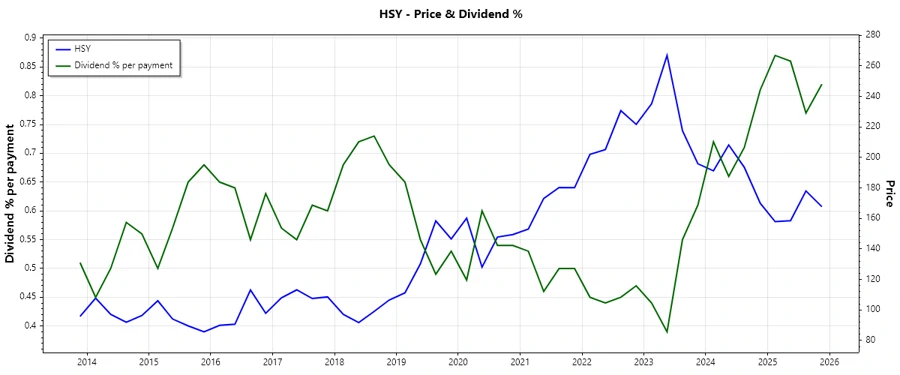
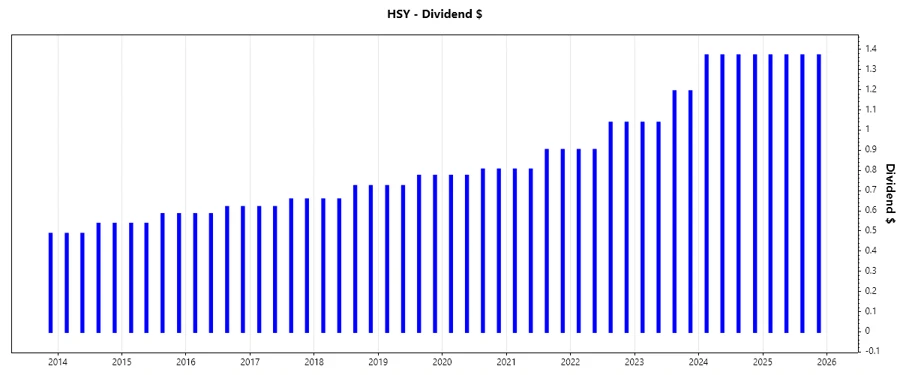
🗣️ Dividend History
Hershey's dividend history demonstrates resilience, with a consistent increase over recent years, a vital sign of financial health and management effectiveness.
| Year | Dividend per Share (USD) |
|---|---|
| 2025 | 5.48 |
| 2024 | 5.48 |
| 2023 | 4.456 |
| 2022 | 3.874 |
| 2021 | 3.410 |
📈 Dividend Growth
Stable dividend growth over the last 5 years indicates progressive management strategies and robust financial performance, crucial for long-term investors.
| Time | Growth |
|---|---|
| 3 years | 0.17% |
| 5 years | 0.13% |
The average dividend growth is 0.13% over 5 years. This shows moderate but steady dividend growth.
✅ Payout Ratio
An EPS-based payout ratio of 79.98% showcases Hershey's commitment to returning earnings to investors but also indicates a high level of profit distribution, whereas the free cash flow-based ratio of 50.23% suggests a more balanced approach when considering cash flow.
| Key figure ratio | Value |
|---|---|
| EPS-based | 79.98% |
| Free cash flow-based | 50.23% |
The EPS payout ratio of 79.98% indicates high earnings distribution, suggesting possible sustainability concerns without further growth, while the FCF-based metric provides assurance in cash-flow backed distributions.
⚠️ Cashflow & Capital Efficiency
Effective capital allocation and cash flow stability ensure sustainable operations and dividend stability, critical for long-term financial health and efficiency in capital deployment.
| Metric | 2024 | 2023 | 2022 |
|---|---|---|---|
| Free Cash Flow Yield | 5.60% | 4.07% | 3.80% |
| Earnings Yield | 6.46% | 4.88% | 3.46% |
| CAPEX to Operating Cash Flow | 23.94% | 33.19% | 22.32% |
| Stock-based Compensation to Revenue | 0.40% | 0.73% | 0.63% |
| Free Cash Flow / Operating Cash Flow Ratio | 76.06% | 66.81% | 77.68% |
Hershey demonstrates efficient capital management and robust cash flow positions, supporting free cash flow and operational metrics, enhancing investment appeal.
⚠️ Balance Sheet & Leverage Analysis
Analyzing liquidity and debt ratios provides insight into financial health and operational security, critical for assessing company leverage and long-term viability.
| Metric | 2024 | 2023 | 2022 |
|---|---|---|---|
| Debt-to-Equity | 1.16 | 1.25 | 1.55 |
| Debt-to-Assets | 0.42 | 0.43 | 0.47 |
| Debt-to-Capital | 0.54 | 0.56 | 0.61 |
| Net Debt to EBITDA | 1.52 | 1.72 | 1.91 |
| Current Ratio | 0.96 | 0.97 | 0.80 |
| Quick Ratio | 0.64 | 0.52 | 0.44 |
| Financial Leverage | 2.75 | 2.90 | 3.32 |
Hershey's stable leverage metrics and improving current and quick ratios suggest adequate liquidity and manageable debt, albeit with room for optimization.
📈 Fundamental Strength & Profitability
Profitability metrics reflect operational success and strategic focus, vital for sustaining growth and delivering long-term shareholder value.
| Metric | 2024 | 2023 | 2022 |
|---|---|---|---|
| Return on Equity | 47.11% | 45.42% | 49.85% |
| Return on Assets | 17.16% | 15.64% | 15.02% |
| Net Margin | 19.83% | 16.67% | 15.79% |
| EBITDA Margin | 27.70% | 24.66% | 23.38% |
| Research & Development to Revenue | 0% | 0% | 0% |
Hershey's strong profitability metrics, including superior ROE and healthy margins, highlight a robust operational model with significant shareholder returns.
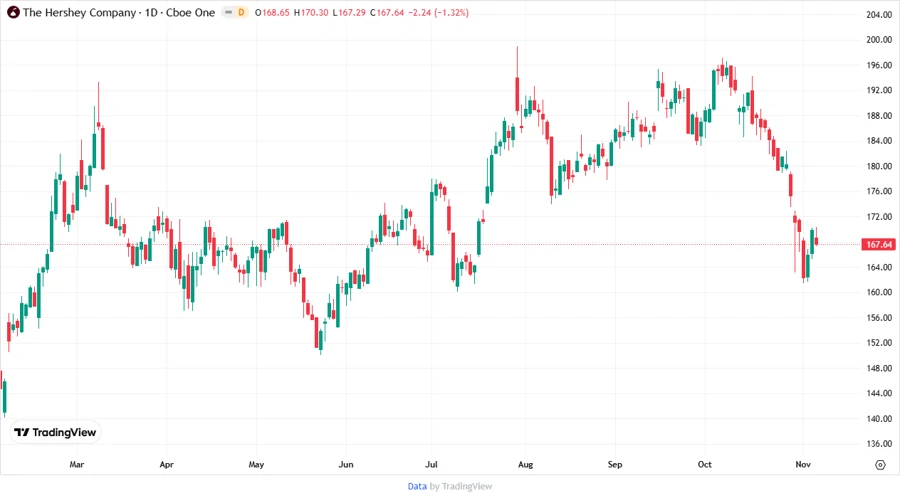
Price Development
✅ Dividend Scoring System
| Category | Description | Score |
|---|---|---|
| Dividend yield | 3.27% yield offers competitive return | |
| Dividend Stability | 41 years of stable dividends | |
| Dividend growth | 0.13% average growth over 5 years | |
| Payout ratio | Moderate payout levels | |
| Financial stability | Improving leverage ratios | |
| Dividend continuity | No cuts since 1991 | |
| Cashflow Coverage | Strong cash flow backing dividends | |
| Balance Sheet Quality | Solid balance sheet metrics |
Total Score: 33/40
🗣️ Rating
With a strong history of dividend stability and moderate growth, Hershey is recommended for investors seeking reliable income streams coupled with potential for moderate capital appreciation, albeit with close monitoring of payout ratios and financial leverage for future sustainability.
Smart Data Insight
Master the Perfect Entry & Exit for this Stock
Don't leave your profits to chance. Historically, this stock follows specific seasonal patterns that institutional traders use to maximize returns.
- ✅ Identify the "Golden Buying Window"
- ✅ Avoid high-risk correction cycles
- ✅ Backtested data from the last 20+ years