October 25, 2025 a 07:46 am

HSY: Dividend Analysis - The Hershey Company
The Hershey Company has established a solid dividend profile, characterized by a respectable yield and a consistent growth history. With a market capitalization of approximately $36.37 billion, Hershey’s commitment to delivering shareholder value is evident through its strategic dividend policies. The company boasts an impressive 41-year history of dividend payments without suspensions, reflecting a stable financial strategy.
📊 Overview
The Hershey Company operates within the Consumer Defensive sector, a segment known for its resilience during economic downturns. The current dividend yield stands at 3.08%, which is attractive for income-focused investors. With a current dividend per share of $5.34 and 41 years of consistent dividend distributions, Hershey demonstrates reliability and commitment to shareholder returns. Notably, the company has not experienced recent cuts or suspensions, underscoring a stability appreciated by long-term investors.
| Metric | Details |
|---|---|
| Sector | Consumer Defensive |
| Dividend Yield | 3.08% |
| Current Dividend per Share | $5.34 |
| Dividend History | 41 years |
| Last Cut or Suspension | None |
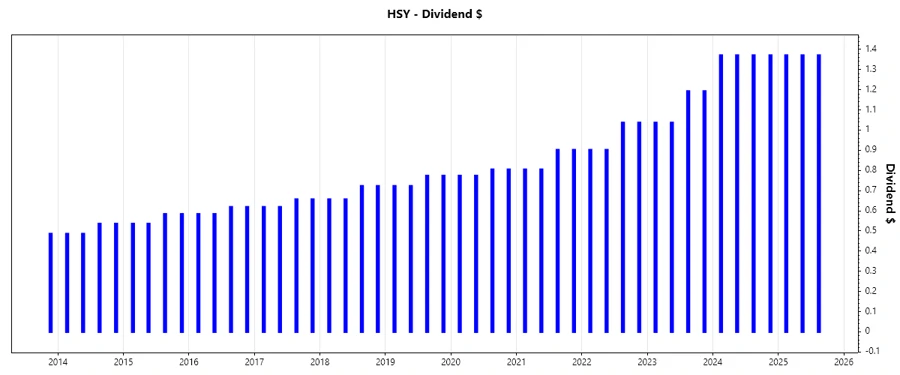
📚 Dividend History
The Hershey Company’s dividend history is a testament to its resilience and financial discipline. A 41-year streak of consecutive dividends demonstrates strong management and a commitment to returning capital to shareholders. This is a key indicator for investors seeking consistent income sources.
| Year | Dividend Per Share (USD) |
|---|---|
| 2025 | 4.11 |
| 2024 | 5.48 |
| 2023 | 4.456 |
| 2022 | 3.874 |
| 2021 | 3.410 |
📈 Dividend Growth
Dividend growth at Hershey has been steady, albeit moderate. Over the last 5 years, the company has achieved a dividend growth rate of 12.88%, which suggests a stable enhancement in shareholder returns despite market volatilities. This consistent growth is crucial for investors seeking to hedge against inflation and increase income over time.
| Time | Growth |
|---|---|
| 3 years | 17.13% |
| 5 years | 12.88% |
The average dividend growth is 12.88% over 5 years. This shows moderate but steady dividend growth.
🧮 Payout Ratio
Payout ratios are crucial in assessing the sustainability of the dividend policy. Hershey’s EPS payout ratio stands at 70.88%, while the free cash flow payout ratio is slightly lower at 68.63%. These metrics indicate that while the company returns a significant portion of earnings to shareholders, it maintains sufficient retained earnings for reinvestment and growth initiatives.
| Key Figure Ratio | Percentage |
|---|---|
| EPS-Based | 70.88% |
| Free Cash Flow-Based | 68.63% |
The payout ratios suggest balanced capital allocation, enabling growth initiatives while ensuring shareholder wealth maximization. However, the high payout may also imply limited room for future increases.
💸 Cashflow & Capital Efficiency
Analyzing cash flows provides insights into a company's operational efficiency. Hershey's free cash flow yield is 4.34%, and its earnings yield is 4.20%. With a CAPEX to operating cash flow ratio of 26.41%, Hershey demonstrates prudent capital reinvestment strategies. Moreover, stock-based compensation is nominal relative to revenue, implying effective cost management.
| Metric | 2022 | 2023 | 2024 |
|---|---|---|---|
| Free Cash Flow Yield | 3.80% | 4.06% | 5.60% |
| Earnings Yield | 3.46% | 4.88% | 6.46% |
| CAPEX to Operating Cash Flow | 22.32% | 33.19% | 23.94% |
| Stock-based Compensation to Revenue | 0.63% | 0.73% | 0.40% |
| Free Cash Flow / Operating Cash Flow Ratio | 77.68% | 66.81% | 76.06% |
The stable cash flow generation, combined with efficient capital utilization, positions Hershey well for sustained operational performance and potential dividend enhancements.
🏦 Balance Sheet & Leverage Analysis
Hershey's financial leverage is a double-edged sword, amplifying returns yet introducing risks. The debt-to-equity and net debt-to-EBITDA ratios are carefully balanced to sustain financial stability. A quick ratio above industry average reinforces short-term financial health.
| Metric | 2022 | 2023 | 2024 |
|---|---|---|---|
| Debt-to-Equity | 1.55 | 1.25 | 1.15 |
| Debt-to-Assets | 46.74% | 43.06% | 42.08% |
| Debt-to-Capital | 60.80% | 55.56% | 53.61% |
| Net Debt to EBITDA | 1.91 | 1.72 | 1.52 |
| Current Ratio | 0.80 | 0.97 | 0.96 |
| Quick Ratio | 0.44 | 0.52 | 0.64 |
| Financial Leverage | 3.32 | 2.90 | 2.75 |
With moderate leverage and adequate liquidity, Hershey maintains a robust balance sheet, allowing significant flexibility to navigate economic cycles and strategic investments.
🌟 Fundamental Strength & Profitability
Profitability measures reflect Hershey's competitive edge in the industry. The company has consistently posted strong return metrics, with a notable emphasis on effective asset utilization and equity returns. Additionally, robust margins ensure a competitive positioning in varying market conditions.
| Metric | 2022 | 2023 | 2024 |
|---|---|---|---|
| Return on Equity | 49.85% | 45.42% | 47.11% |
| Return on Assets | 15.02% | 15.64% | 17.16% |
| Net Margin | 15.79% | 16.68% | 19.83% |
| EBIT Margin | 19.74% | 20.90% | 23.64% |
| EBITDA Margin | 23.38% | 24.66% | 27.70% |
| Gross Margin | 43.18% | 44.76% | 47.32% |
| R&D to Revenue | 0% | 0% | 0% |
Hershey’s focus on maintaining high profitability and reinvesting wisely bodes well for future growth prospects, aligning with the strategic goals of maximizing shareholder value.
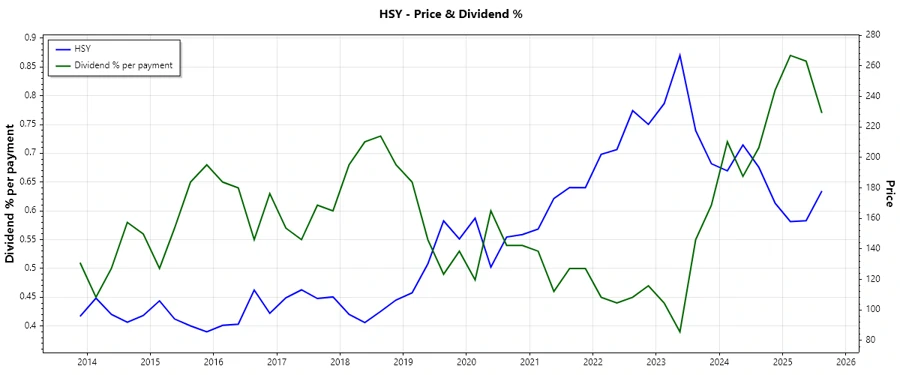
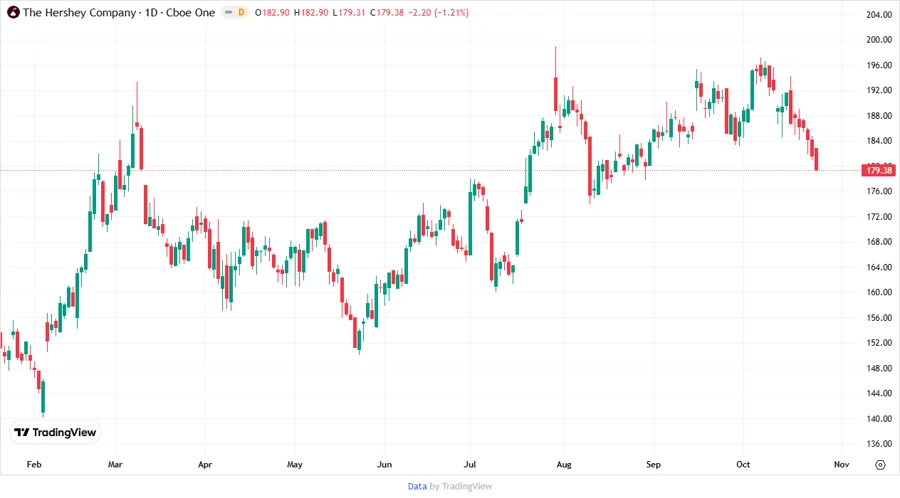
📉 Price Development
✅ Dividend Scoring System
Our custom dividend scoring system evaluates Hershey's dividend profile based on key metrics, offering insights into its attractiveness. Below is the scoring:
| Criteria | Score (1-5) | Score Bar |
|---|---|---|
| Dividend Yield | 4 | |
| Dividend Stability | 5 | |
| Dividend Growth | 3 | |
| Payout Ratio | 3 | |
| Financial Stability | 4 | |
| Dividend Continuity | 5 | |
| Cashflow Coverage | 4 | |
| Balance Sheet Quality | 4 |
Overall Score: 32/40
🗣️ Rating
In conclusion, The Hershey Company presents a compelling dividend investment opportunity. Strong fundamentals, coupled with a robust history of dividend stability and growth, make it a likely candidate for investors seeking income with moderate growth potential. However, while its payout ratios suggest some caution, its financial resilience and operational efficiencies warrant a positive investment outlook. The Hershey Company is thus recommended for consideration in a diversified dividend-focused portfolio.
Smart Data Insight
Master the Perfect Entry & Exit for this Stock
Don't leave your profits to chance. Historically, this stock follows specific seasonal patterns that institutional traders use to maximize returns.
- ✅ Identify the "Golden Buying Window"
- ✅ Avoid high-risk correction cycles
- ✅ Backtested data from the last 20+ years