
July 12, 2026 a 02:46 am

HST: Dividend Analysis - Host Hotels & Resorts, Inc.
Host Hotels & Resorts, Inc. presents a robust dividend profile with a current yield of 7.04% and a history spanning 35 years. The company has consistently managed its payout ratios alongside moderate dividend growth, demonstrating a balance between rewarding shareholders and maintaining financial stability, despite the recent dividend cut in 2025. This analysis delves into the key factors influencing its dividend performance.
📊 Overview
Host Hotels & Resorts, Inc., operating in the Real Estate sector, showcases an impressive dividend yield of 7.04%, a testament to its shareholder-friendly policies. The current dividend per share stands at $0.90, reflecting contributions over 35 years of dependable dividend history, although a recent cut or suspension occurred in 2025.
| Attribute | Value |
|---|---|
| Sector | Real Estate |
| Dividend yield | 7.04 % |
| Current dividend per share | 0.90 USD |
| Dividend history | 35 years |
| Last cut or suspension | 2025 |
🗣️ Dividend History
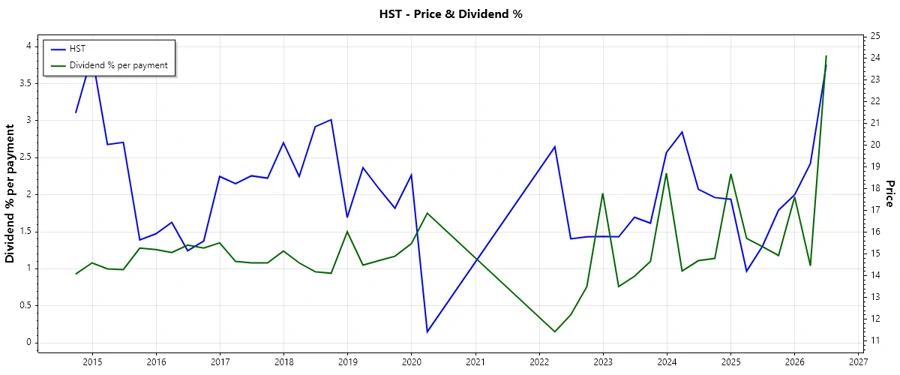
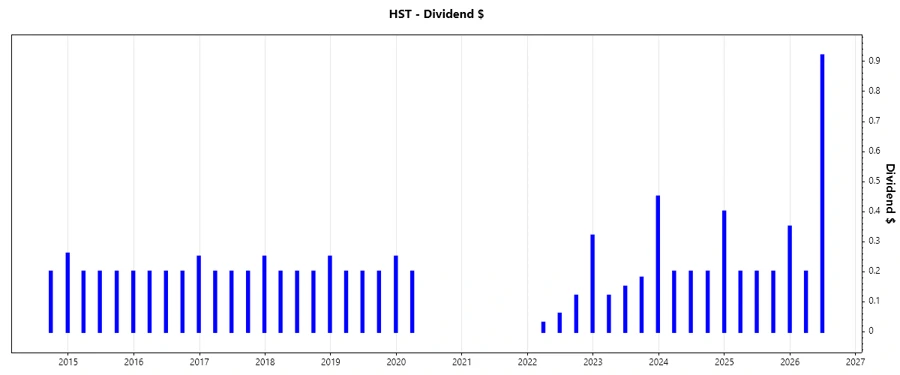
The historical dividend payments reflect the company’s commitment to its shareholders, providing a consistent and growing income stream. Analyzing these payments is essential for understanding past payout trends and the company's resilience in maintaining dividends even during economic downturns.
| Year | Dividend per Share (USD) |
|---|---|
| 2026 | 1.12 |
| 2025 | 0.95 |
| 2024 | 1.00 |
| 2023 | 0.90 |
| 2022 | 0.53 |
📈 Dividend Growth
Dividend growth offers insights into a company’s capacity to increase shareholder returns over time. Evaluating the growth rates over a three to five-year time frame is crucial for assessing the sustainability of dividend increases and the company’s financial health.
| Time | Growth |
|---|---|
| 3 years | 0.21 % |
| 5 years | 0.37 % |
The average dividend growth is 0.37% over 5 years. This shows moderate but steady dividend growth.
⚠️ Payout Ratio
The payout ratio is a crucial indicator of how sustainable a company's dividend is relative to its earnings and free cash flow. A comfortable payout ratio indicates a healthy balance between rewarding shareholders and retaining earnings for future growth.
| Key figure | Ratio |
|---|---|
| EPS-based | 61.62 % |
| Free cash flow-based | 66.75 % |
A payout ratio of 61.62% based on EPS and 66.75% based on FCF indicates the company's ability to maintain its current dividend levels with room for reinvestment.
✅ Cashflow & Capital Efficiency
Cashflow and capital efficiency metrics are vital for evaluating a company’s ability to sustain its dividend payments and capitalize on investment opportunities. The ratios provided give insight into cash generation capacity and capital deployment effectiveness.
| Year | 2023 | 2024 | 2025 |
|---|---|---|---|
| Free Cash Flow Yield | 5.75% | 7.72% | 6.99% |
| Earnings Yield | 5.36% | 5.67% | 6.23% |
| CAPEX to Operating Cash Flow | 44.83% | 36.58% | 40.18% |
| Stock-based Compensation to Revenue | 0.56% | 0.42% | 0.42% |
| Free Cash Flow / Operating Cash Flow Ratio | 55.17% | 63.42% | 57.12% |
The cashflow stability remains robust with efficient capital allocation, highlighting sound investment controls.
📉 Balance Sheet & Leverage Analysis
Balance sheet strength and leverage metrics are essential for evaluating financial stability and the company's ability to meet its financial obligations. These figures help assess risk exposure and financial flexibility.
| Year | 2023 | 2024 | 2025 |
|---|---|---|---|
| Debt-to-Equity | 0.72 | 0.85 | 0.86 |
| Debt-to-Assets | 0.39 | 0.43 | 0.43 |
| Debt-to-Capital | 0.42 | 0.46 | 0.46 |
| Net Debt to EBITDA | 2.17 | 3.00 | 2.64 |
| Current Ratio | 1.07 | 0.65 | 21.93 |
| Quick Ratio | 1.07 | 0.65 | 21.93 |
| Financial Leverage | 1.85 | 1.97 | 1.99 |
The leverage ratios are consistent with solid financial management, ensuring stability with considerable capacity for debt service.
🔍 Fundamental Strength & Profitability
These metrics evaluate the company’s intrinsic value and operational efficiency, crucial for long-term sustainable growth. Margins and returns on equity measure success against peers and industry standards.
| Year | 2023 | 2024 | 2025 |
|---|---|---|---|
| Return on Equity | 11.16% | 10.55% | 11.67% |
| Return on Assets | 6.04% | 5.34% | 5.86% |
| Margins: Net | 13.93% | 12.26% | 12.51% |
| EBIT | 18.36% | 16.47% | 17.22% |
| EBITDA | 31.48% | 29.87% | 30.23% |
| Gross | 53.66% | 53.36% | 2.62% |
| R&D to Revenue | 0% | 0% | 0% |
The profitability metrics reflect a generally positive performance, with steady margins and strong returns, ensuring comprehensive financial health.
📈 Price Development
🎯 Dividend Scoring System
This scoring system evaluates the overall dividend quality, incorporating multiple financial aspects.
| Category | Score (out of 5) | Scoring Bar |
|---|---|---|
| Dividend yield | 4 | |
| Dividend Stability | 3 | |
| Dividend growth | 3 | |
| Payout ratio | 3 | |
| Financial stability | 4 | |
| Dividend continuity | 3 | |
| Cashflow Coverage | 4 | |
| Balance Sheet Quality | 4 |
Total Score: 28/40
🗳️ Rating
In conclusion, Host Hotels & Resorts, Inc. demonstrates a modest but promising dividend profile with a strong yield and reliable growth over the years. With a total score of 28 out of 40 in our dividend scoring system, investors can expect steady returns with a potential for long-term appreciation. While recent changes to dividend practices present slight uncertainties, the overall financial health and commitment to dividends suggest a favorable outlook for dividend-focused investors.
Smart Data Insight
Master the Perfect Entry & Exit for this Stock
Don't leave your profits to chance. Historically, this stock follows specific seasonal patterns that institutional traders use to maximize returns.
- ✅ Identify the "Golden Buying Window"
- ✅ Avoid high-risk correction cycles
- ✅ Backtested data from the last 20+ years