October 18, 2025 a 12:46 pm

HST: Dividend Analysis - Host Hotels & Resorts, Inc.
Host Hotels & Resorts presents a robust dividend profile characterized by a consistent dividend yield of 5.29% and an extensive dividend history of 36 years. Despite a substantial EPS payout ratio of 110.31%, the company continues to provide a significant total return potential for long-term investors.
📊 Overview
Host Hotels & Resorts operates in a competitive real estate sector, with a focus on maintaining steady dividend payouts. The company's current dividend yield is an attractive 5.29%, with a history of paying dividends consistently over the past 36 years. However, the company last cut or suspended its dividends in recent history remains undocumented, indicating its commitment to shareholder value.
| Metric | Value |
|---|---|
| Sector | Real Estate |
| Dividend Yield | 5.29% |
| Current Dividend Per Share | $1.05 |
| Dividend History | 36 years |
| Last Cut/Suspension | None |
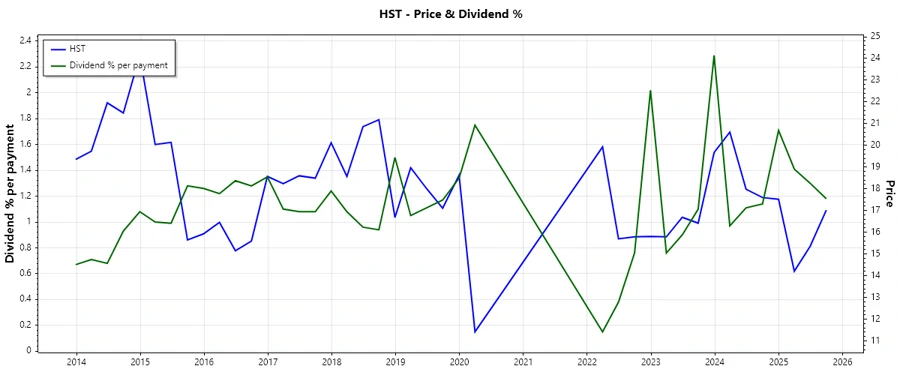
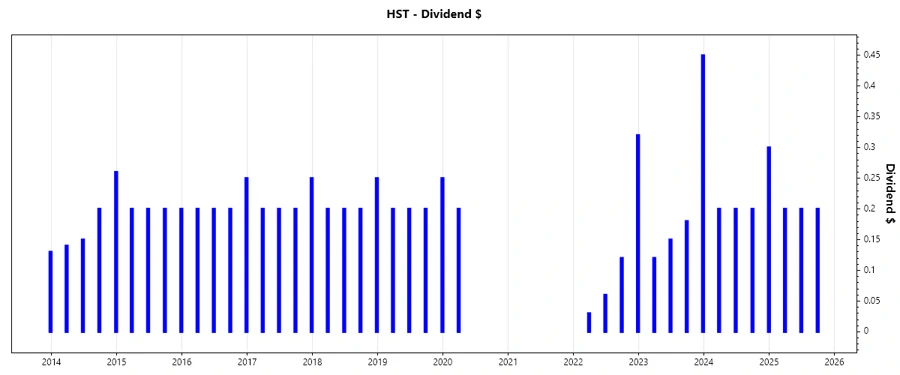
🗣️ Dividend History
The dividend history of Host Hotels & Resorts depicts a pattern of stability and resilience, crucial for investors seeking steady income. With dividends paid without interruption over three decades, the company exemplifies reliability in profit distribution despite economic cycles.
| Year | Dividend Per Share (USD) |
|---|---|
| 2025 | $0.60 |
| 2024 | $0.90 |
| 2023 | $0.90 |
| 2022 | $0.53 |
| 2020 | $0.20 |
📈 Dividend Growth
Dividend growth is vital for assessing a company's ongoing ability to increase shareholder returns. Host Hotels & Resorts showcases a modest dividend growth rate of 0.65% over three years, with an insignificant increase over five years. This slower growth may raise questions regarding underlying growth drivers or financial strategy.
| Time | Growth |
|---|---|
| 3 years | 0.65% |
| 5 years | 0.01% |
The average dividend growth is 0.01% over 5 years. This shows moderate but steady dividend growth.
📉 Payout Ratio
Examining payout ratios is fundamental in understanding the sustainability of dividend payments. A high payout ratio suggests greater risk of cuts should earnings falter. Host Hotels & Resorts has an EPS-based payout ratio of 110.31%, exceeding its earnings, while its free cash flow-based payout ratio sits lower at 89.43%, indicating potential red flags in dividend coverage.
| Key Figure | Ratio |
|---|---|
| EPS-based | 110.31% |
| Free Cash Flow-based | 89.43% |
Although the payout ratio based on EPS is concerning, the FCF-based ratio offers a slightly more sustainable picture, suggesting continued pressure on operational efficiency.
✅ Cashflow & Capital Efficiency
Free cash flow metrics and capital efficiency provide insights into the financial health and potential growth capacity of a company. Host Hotels & Resorts reflects a robust free cash flow yield of 7.21% in recent years, supporting ongoing investments despite significant capital expenditures. Nonetheless, the high EV/OCF ratio demands close scrutiny for future liquidity assurance.
| Metric | 2022 | 2023 | 2024 |
|---|---|---|---|
| Free Cash Flow Yield | 7.95% | 5.75% | 7.72% |
| Earnings Yield | 5.52% | 5.36% | 5.67% |
| CAPEX to Operating Cash Flow | 35.59% | 44.83% | 36.58% |
| Stock-based Compensation to Revenue | 0.53% | 0.56% | 0.42% |
| Free Cash Flow / Operating Cash Flow Ratio | 64.41% | 55.17% | 63.42% |
The cash flow analysis indicates a stable free cash flow outlook and efficient capital use, enhancing investor confidence amid volatile markets.
⚠️ Balance Sheet & Leverage Analysis
Given the company's debt structure, Host Hotels & Resorts presents a balanced leverage profile, maintaining a debt-to-equity ratio of just under 0.86 across recent years, backed by adequate interest coverage. Net debt to EBITDA has decreased, suggesting a controlled leverage environment suitable for potential growth engagements.
| Metric | 2022 | 2023 | 2024 |
|---|---|---|---|
| Debt-to-Equity | 0.71 | 0.72 | 0.85 |
| Debt-to-Assets | 0.39 | 0.39 | 0.43 |
| Debt-to-Capital | 0.42 | 0.41 | 0.46 |
| Net Debt to EBITDA | 2.90 | 2.17 | 3.32 |
| Current Ratio | 0.96 | 1.07 | 0.65 |
The company's balance sheet reveals sound financial standing, with sufficient liquidity to buffer economic uncertainties.
🔍 Fundamental Strength & Profitability
Host Hotels & Resorts evidences stable profitability margins, with consistent returns on equity and assets. Such fundamentals underpin the company's robust market positioning, crucial for sustained dividend offerings and competitive agility.
| Metric | 2022 | 2023 | 2024 |
|---|---|---|---|
| Return on Equity | 9.43% | 11.16% | 10.55% |
| Return on Assets | 5.16% | 6.04% | 5.34% |
| Net Margin | 12.90% | 13.93% | 12.26% |
| EBIT Margin | 16.81% | 18.36% | 13.69% |
| Research & Development to Revenue | 0% | 0% | 0% |
Solid profitability metrics affirm Host Hotels & Resorts' operational efficiency and strategic leverage in achieving continued growth.
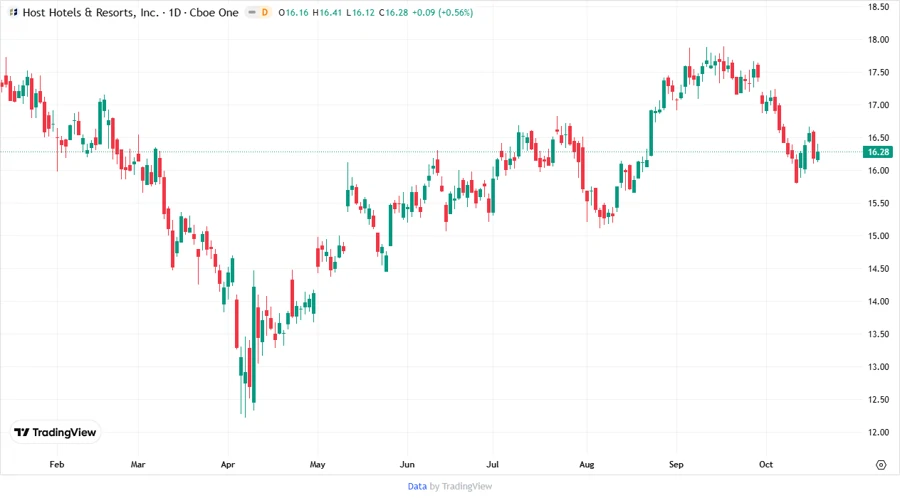
📉 Price Development
📊 Dividend Scoring System
| Criteria | Score (out of 5) | Score Bar |
|---|---|---|
| Dividend Yield | 4 | |
| Dividend Stability | 5 | |
| Dividend Growth | 2 | |
| Payout Ratio | 2 | |
| Financial Stability | 3 | |
| Dividend Continuity | 5 | |
| Cashflow Coverage | 3 | |
| Balance Sheet Quality | 4 |
Total Score: 28/40
✅ Rating
Host Hotels & Resorts receives a strong dividend rating, reflecting remarkable stability and continuity in shareholder returns. However, conservative growth rates and high payout ratios denote caution, suggesting a prudent investment approach for income-focused investors. Overall, Host Hotels continues to be a compelling choice within its sector, offering notable benefits amid potential volatility.
Smart Data Insight
Master the Perfect Entry & Exit for this Stock
Don't leave your profits to chance. Historically, this stock follows specific seasonal patterns that institutional traders use to maximize returns.
- ✅ Identify the "Golden Buying Window"
- ✅ Avoid high-risk correction cycles
- ✅ Backtested data from the last 20+ years