November 08, 2025 a 11:44 am
HSIC: Fibunacci Analysis - Henry Schein, Inc.
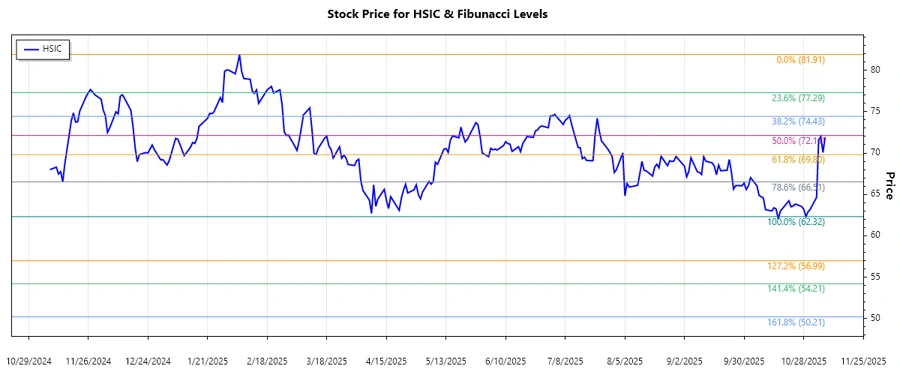
The stock of Henry Schein, Inc. (HSIC) has shown a mixed performance in recent months. Despite some fluctuations, the latest trend suggests a downturn. Investors need to exercise caution and closely monitor various technical indicators such as the Fibonacci retracement levels to identify potential opportunities or risks in the market. With its focus on health care products and services, along with its technological advancements, HSIC continues to remain a significant player in the healthcare industry.
Fibonacci Analysis
| Details | Information |
|---|---|
| Trend Period | 2024-11-08 to 2025-11-07 |
| High Point | $81.91 on 2025-02-05 |
| Low Point | $62.32 on 2025-10-29 |
| Fibonacci Level | Price Level |
|---|---|
| 0.236 | $67.76 |
| 0.382 | $70.37 |
| 0.5 | $72.11 |
| 0.618 | $73.86 |
| 0.786 | $76.48 |
Currently, the price of HSIC is in the 0.236 Fibonacci retracement zone at approximately $67.76, suggesting potential support at this level.
The retracement suggests the potential for stabilization or reversal if the support level holds. However, a break below could indicate further downside.
Conclusion
The current technical indicators suggest Henry Schein, Inc. may face challenges if support levels don't hold. However, if they do, it could represent a buying opportunity. Given its solid presence in the healthcare sector and technological advancements, HSIC presents both opportunities and risks. A sustained move above the higher Fibonacci levels could indicate a shift towards an uptrend. However, continued diligence is critical for investors to navigate potential volatility.
Smart Data Insight
Master the Perfect Entry & Exit for this Stock
Don't leave your profits to chance. Historically, this stock follows specific seasonal patterns that institutional traders use to maximize returns.
- ✅ Identify the "Golden Buying Window"
- ✅ Avoid high-risk correction cycles
- ✅ Backtested data from the last 20+ years