June 24, 2025 a 05:15 am

HSIC: Fibonacci Analysis - Henry Schein, Inc.
Henry Schein, Inc. has shown resilience in the healthcare distribution industry, providing essential products to dental and medical practitioners worldwide. The recent trend indicates a shift in price levels, providing insights for investors to explore potential support and resistance zones.
Fibonacci Analysis
| Aspect | Details |
|---|---|
| Start Date | 2024-11-13 |
| End Date | 2025-06-23 |
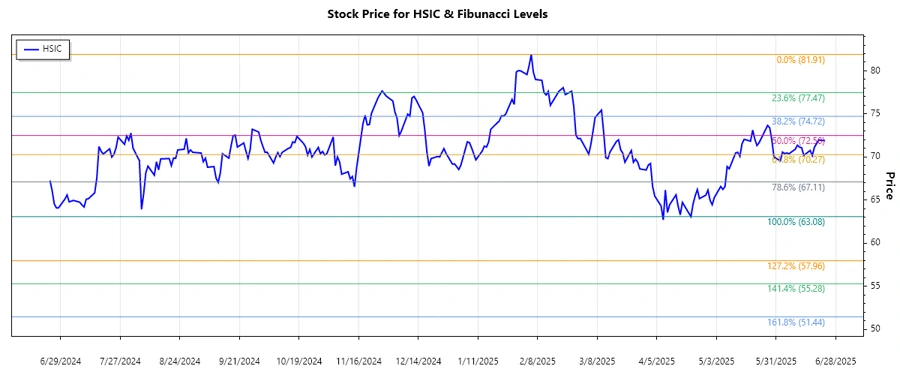
| High Point | $81.91 (2025-02-05) |
| Low Point | $63.08 (2025-04-21) |
| Current Price | $71.89 |
Fibonacci Retracement Levels
| Level | Price |
|---|---|
| 0.236 | $67.68 |
| 0.382 | $70.09 |
| 0.5 | $72.50 |
| 0.618 | $74.91 |
| 0.786 | $78.46 |
The current price of $71.89 is hovering just above the 0.382 Fibonacci retracement level. This suggests a potential support level; should the price bounce from here, it could imply a bullish continuation.
Conclusion
The technical analysis of Henry Schein, Inc. indicates potential robustness in the stock price with immediate support near the 0.382 Fibonacci level. While the stock has seen volatility, this offers both opportunities for upward momentum and risks if it fails to hold above this level. For technical analysts, maintaining a watchful eye on these retracement levels will be essential for navigating potential trades and understanding strength dynamics in play.
Smart Data Insight
Master the Perfect Entry & Exit for this Stock
Don't leave your profits to chance. Historically, this stock follows specific seasonal patterns that institutional traders use to maximize returns.
- ✅ Identify the "Golden Buying Window"
- ✅ Avoid high-risk correction cycles
- ✅ Backtested data from the last 20+ years