December 11, 2025 a 10:15 am

HRL: Fibonacci Analysis - Hormel Foods Corporation
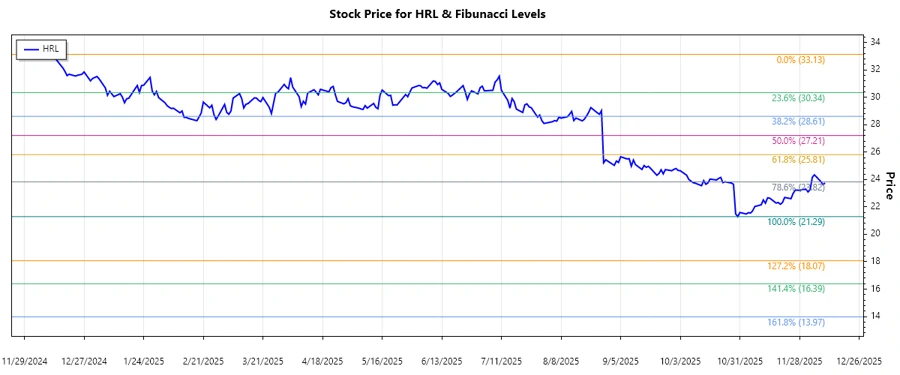
Hormel Foods Corporation, known for its range of meat and food products, has recently faced a downward trend in its stock price. Analyzing historical data reveals a significant decline over the past months, which may indicate changes in market sentiment or company-specific factors influencing investor behavior.
Fibonacci Analysis
| Information | Details |
|---|---|
| Start Date | 2024-12-11 |
| End Date | 2025-12-10 |
| High Price | $33.13 on 2024-12-11 |
| Low Price | $21.29 on 2025-10-30 |
| Fibonacci Level | Price |
|---|---|
| 0.236 | $24.59 |
| 0.382 | $26.26 |
| 0.500 | $27.21 |
| 0.618 | $28.16 |
| 0.786 | $29.38 |
The current price as of 2025-12-10 is $23.74, which suggests the stock is below the 0.236 retracement level. This indicates that the stock is not currently in a retracement zone, suggesting ongoing downward momentum.
Technically, the stock might find potential support near $21.29 or experience resistance if attempting to retrace upside towards the Fibonacci levels identified above.
Conclusion
The downward trend in Hormel Foods Corporation's stock reflects potential challenges or shifts in market perception. While Fibonacci levels highlight possible retracement zones offering resistance, the current price indicates continued bearish momentum. Investors should consider broader market conditions and company fundamentals, including possible disruptions in the food industry or changes to consumer preferences. As with any stock, monitoring economic indicators and earnings reports can provide essential insights for future movements. Caution is advised until significant support or signals for a trend reversal emerge.