December 27, 2025 a 07:46 am


HRL: Dividend Analysis - Hormel Foods Corporation
Hormel Foods Corporation presents a robust dividend profile, highlighted by its impressive 42-year streak of consistent dividend payouts. However, the future yield prospects might be undermined by a recent pay cut in 2026, warranting careful investor consideration. Despite these challenges, the company's solid historical adherence to payouts displays a commitment to shareholder value.
📊 Overview
| Key Metric | Value |
|---|---|
| Sector | Consumer Goods |
| Dividend Yield | 4.79% |
| Current Dividend Per Share | 1.15 USD |
| Dividend History | 42 years |
| Last Cut or Suspension | 2026 |
🗣️ Dividend History
The elegance of Hormel's dividend history lies in its 42-year uninterrupted streak, reflective of stability and resilience. This information is crucial as it speaks to the company's reliability in shareholder returns amidst various market conditions.
| Year | Dividend Per Share (USD) |
|---|---|
| 2026 | 0.2925 |
| 2025 | 1.16 |
| 2024 | 1.13 |
| 2023 | 1.10 |
| 2022 | 1.04 |
📈 Dividend Growth
Exhibiting moderate yet steady growth, Hormel's dividend expansion showcases an increment of 4.86% over 3 years and 6.11% over 5 years. This reflects the company's capacity for incremental, reliable shareholder value enhancement.
| Time | Growth |
|---|---|
| 3 years | 4.86 % |
| 5 years | 6.11 % |
The average dividend growth is 6.11% over 5 years. This shows moderate but steady dividend growth.
✅ Payout Ratio
A meticulous analysis of Hormel's payout ratios reveals significant commitments: 132.50% based on EPS and 118.49% based on FCF. Understanding these metrics is paramount for assessing the sustainability of dividend payments in relation to profitability and cash flows.
| Key Figure | Ratio |
|---|---|
| EPS-based | 132.50% |
| Free Cash Flow-based | 118.49% |
The high payout ratio could indicate potential stress on financial reserves, urging caution among dividend-seeking investors.
⚠️ Cashflow & Capital Efficiency
Cashflow and capital efficiency figures are critical indicators of a company's operational health. Hormel's metrics suggest a careful balance between capital allocations and operational earnings.
| Metric | 2023 | 2024 | 2025 |
|---|---|---|---|
| Free Cash Flow Yield | 4.37% | 6.03% | 4.50% |
| Earnings Yield | 4.46% | 4.81% | 4.03% |
| CAPEX to Operating Cash Flow | 25.79% | 20.24% | 36.78% |
| Stock-based Compensation to Revenue | 0.20% | 0.19% | 0.10% |
| Free Cash Flow / Operating Cash Flow Ratio | 74.21% | 79.76% | 63.22% |
Stable yet efficient cash flows highlight Hormel's adeptness at balancing operational demands with strategic investment returns.
📉 Balance Sheet & Leverage Analysis
An in-depth analysis of Hormel's leverage metrics reveals effective debt management that stands resilient in supporting operational expansion without compromising liquidity needs.
| Metric | 2023 | 2024 | 2025 |
|---|---|---|---|
| Debt-to-Equity | 0.43 | 0.36 | 0.36 |
| Debt-to-Assets | 0.25 | 0.21 | 0.21 |
| Debt-to-Capital | 0.30 | 0.26 | 0.27 |
| Net Debt to EBITDA | 1.92 | 1.54 | 2.17 |
| Current Ratio | 1.43 | 2.32 | 2.47 |
| Quick Ratio | 0.70 | 1.19 | 1.20 |
| Financial Leverage | 1.74 | 1.68 | 1.69 |
These metrics insinuate a judiciously maintained equilibrium between leveraging strategies and risk mitigation.
💼 Fundamental Strength & Profitability
Hormel's core profitability indicators underscore robust fundamental performance, pivotal for stakeholder confidence.
| Metric | 2023 | 2024 | 2025 |
|---|---|---|---|
| Return on Equity | 10.26% | 10.07% | 6.04% |
| Return on Assets | 5.90% | 5.99% | 3.57% |
| Net Margin | 6.55% | 6.75% | 3.95% |
| EBIT Margin | 8.98% | 9.36% | 6.12% |
| EBITDA Margin | 11.07% | 11.53% | 8.30% |
| Gross Margin | 16.51% | 16.96% | 15.63% |
| R&D to Revenue | 0.00% | 0.00% | 0.00% |
The comprehensive profitability margins highlight a potent combination of robust management strategies with effective cost control measures.
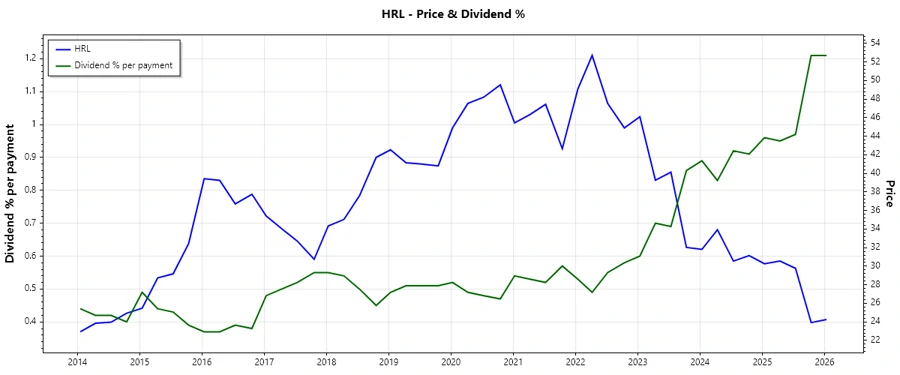
📈 Price Development
🔢 Dividend Scoring System
| Criterion | Score | |
|---|---|---|
| Dividend Yield | 4 | |
| Dividend Stability | 5 | |
| Dividend Growth | 3 | |
| Payout Ratio | 2 | |
| Financial Stability | 4 | |
| Dividend Continuity | 5 | |
| Cashflow Coverage | 3 | |
| Balance Sheet Quality | 4 |
Total Score: 30 out of 40
📊 Rating
Hormel Foods Corporation displays a solid dividend strategy characterized by reliability and consistent returns, albeit with cautionary indicators in payout sustainability amidst recent financial adjustments. Investors should weigh the robust history against contemporary financial pressures, devising appropriately aligned investment decisions.