September 29, 2025 a 04:45 pm
HPQ: Fibonacci Analysis - HP Inc.
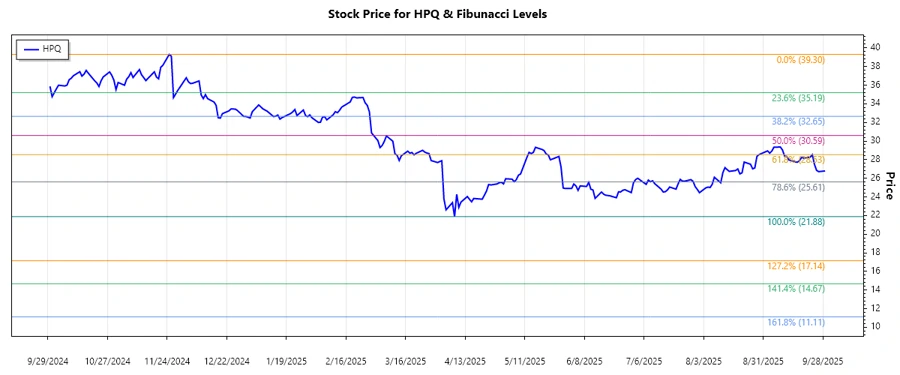
HP Inc. has experienced significant fluctuations in its stock price over recent months. With a diverse portfolio spanning personal computing, printing, and corporate investments, the company's performance is closely tied to global technology sector trends. Recent price movements suggest a strong directional trend, making it a candidate for retracement analysis. Investors need to pay attention to key levels to make informed decisions.
Fibonacci Analysis
| Start Date | End Date | High Price | Low Price |
|---|---|---|---|
| 2024-11-26 | 2025-09-29 | $39.30 (2024-11-25) | $21.88 (2025-04-08) |
| Fibonacci Level | Price Level |
|---|---|
| 0.236 | $27.57 |
| 0.382 | $29.89 |
| 0.5 | $31.69 |
| 0.618 | $33.48 |
| 0.786 | $36.10 |
The current price of $26.785 is below the 0.236 retracement level, suggesting it is not currently in a retracement zone.
Conclusion: The current price being below the 0.236 level indicates potential further weakness, but also an opportunity for value investors if the technical level holds as support.
Conclusion
The HP Inc. stock has displayed a bearish trend since its high last November, but the price resilience above major support levels could indicate potential for reversal. Long-term investors might view the current price levels as an entry opportunity, assuming the support holds. However, the violation of key Fibonacci levels suggests caution is warranted. Monitoring technological sector dynamics and HP Inc.’s strategic initiatives will be crucial. Technical analysis highlights the importance of the stock holding above the $21.88 low.