June 13, 2026 a 02:46 am
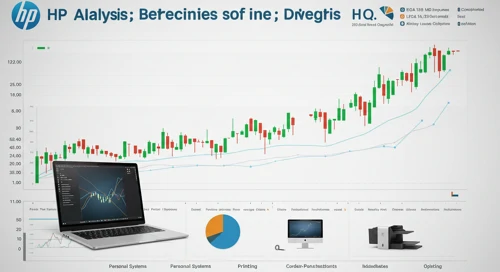
HPQ: Dividend Analysis - HP Inc.
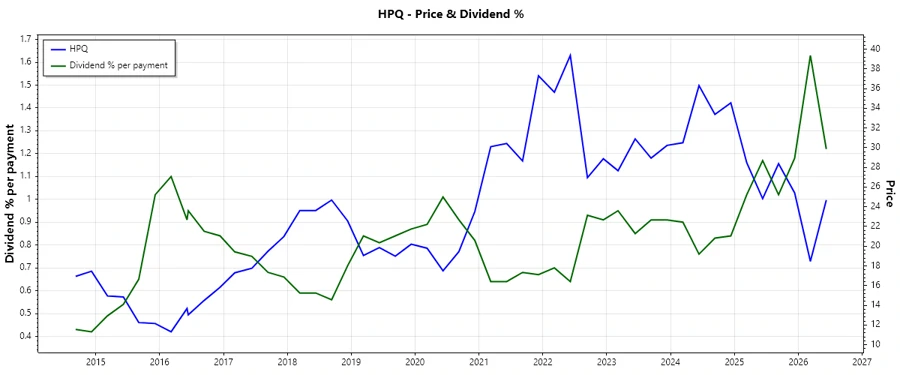
HP Inc. demonstrates a robust dividend profile with a commendable record of 57 consecutive years of dividends. With a satisfactory dividend yield of 4.82%, HP Inc. provides investors a reliable income stream. Despite recent economic fluctuations, the company maintains stable dividend payments, indicating financial resilience and commitment to shareholder returns.
📊 Overview
HP Inc., operating in the technology sector, showcases resilience through its dividend yield of 4.82%, a current dividend per share of 1.15 USD, and an uninterrupted dividend history of 57 years, making it a promising income generator for long-term investors. The absence of recent dividend cuts underscores their stability.
| Attribute | Value |
|---|---|
| Sector | Technology |
| Dividend yield | 4.82% |
| Current dividend per share | 1.15 USD |
| Dividend history | 57 years |
| Last cut or suspension | None |
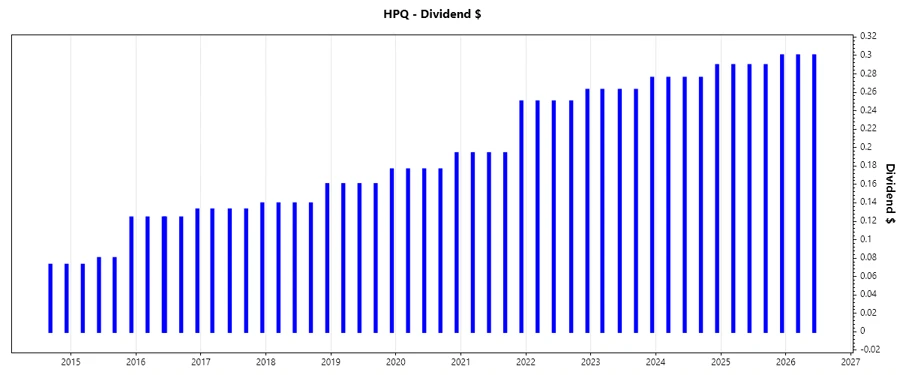
📉 Dividend History
The dividend history of HP Inc. is vital for assessing its commitment to returns. Its consistent dividend payments over the decades have solidified investor confidence and provide a benchmark for potential future performance.
| Year | Dividend per Share (USD) |
|---|---|
| 2026 | 0.60 |
| 2025 | 1.17 |
| 2024 | 1.12 |
| 2023 | 1.06 |
| 2022 | 1.01 |
📈 Dividend Growth
Analyzing HP Inc.'s dividend growth over recent years reveals a strategic increase in shareholder returns. These trends are critical for anticipating future income potential.
| Time | Growth |
|---|---|
| 3 years | 4.88% |
| 5 years | 10.09% |
The average dividend growth is 10.09% over 5 years. This shows moderate but steady dividend growth, reinforcing confidence in the company's progressive dividend policy.
✅ Payout Ratio
The payout ratio is a crucial indicator of dividend sustainability. HP Inc.'s payout ratios indicate efficient earnings use and prudent cash flow management, ensuring reliability of dividend payments.
| Key figure | Ratio |
|---|---|
| EPS-based | 41.54% |
| Free cash flow-based | 27.83% |
With an EPS-based payout ratio of 41.54% and an FCF-based ratio of 27.83%, HP Inc. maintains a conservative approach, balancing reinvestment with rewarding shareholders.
💰 Cashflow & Capital Efficiency
Healthy cash flows are imperative for sustaining operations and dividends. HP Inc.'s financial efficiency through cash flow utilization speaks to its strategic management capabilities.
| Year | 2023 | 2024 | 2025 |
|---|---|---|---|
| Free Cash Flow Yield | 11.34% | 9.08% | 10.70% |
| Earnings Yield | 12.49% | 7.98% | 9.66% |
| CAPEX to Operating Cash Flow | 17.05% | 15.79% | 24.26% |
| Stock-based Compensation to Revenue | 0.82% | 0.84% | 0.94% |
| Free Cash Flow / Operating Cash Flow Ratio | 75.74% | 84.21% | 75.74% |
HP Inc. showcases substantial cash flow stability and capital efficiency, essential for sustaining competitive operations and future growth investments.
🗒️ Balance Sheet & Leverage Analysis
A firm's balance sheet strength is pivotal to its financial robustness. HP Inc.'s leverage ratios offer insight into its debt management and financial flexibility.
| Year | 2023 | 2024 | 2025 |
|---|---|---|---|
| Debt-to-Equity | -10.05 | -8.24 | -31.45 |
| Debt-to-Assets | 29.02% | 27.31% | 26.05% |
| Debt-to-Capital | 111.05% | 113.82% | 103.28% |
| Net Debt to EBITDA | 1.71 | 1.62 | 1.76 |
| Current Ratio | 0.73 | 0.72 | 0.77 |
| Quick Ratio | 0.45 | 0.45 | 0.48 |
| Financial Leverage | -34.62 | -30.17 | -120.72 |
HP Inc.'s declining leverage ratios indicate a strategic reduction of financial risk, improving its long-term solvency and operational agility.
📈 Fundamental Strength & Profitability
Evaluating profitability metrics gives insights into operational efficiency and strategic prowess. HP Inc.'s fundamental strength underpins its growth narrative.
| Year | 2023 | 2024 | 2025 |
|---|---|---|---|
| Return on Equity | -3.05% | -2.10% | -7.31% |
| Return on Assets | 8.82% | 6.95% | 6.05% |
| Margins: Net | 6.07% | 5.18% | 4.57% |
| Margins: EBIT | 6.74% | 7.26% | 5.74% |
| Margins: EBITDA | 8.32% | 8.81% | 7.40% |
| Margins: Gross | 21.42% | 22.07% | 20.07% |
| Research & Development to Revenue | 2.94% | 3.06% | 2.90% |
The company's steadily improved margins affirm its strategic operational improvements and focus on profitability despite challenging market conditions.
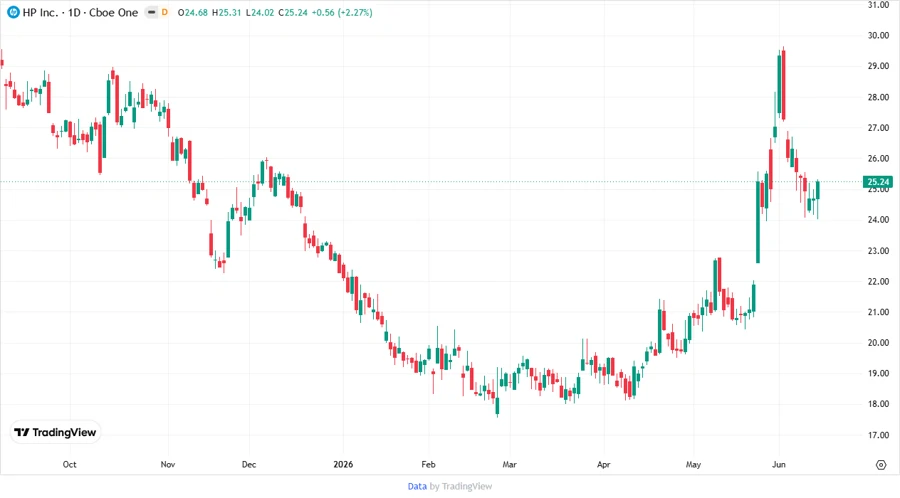
📊 Price Development
🗣️ Dividend Scoring System
| Category | Score | Score Bar |
|---|---|---|
| Dividend yield | 4 | |
| Dividend stability | 5 | |
| Dividend growth | 3 | |
| Payout ratio | 4 | |
| Financial stability | 3 | |
| Dividend continuity | 5 | |
| Cashflow Coverage | 4 | |
| Balance Sheet Quality | 3 |
Total Score: 31/40
🏆 Rating
HP Inc. offers a solid dividend proposition with dependable income and robust historical payments. Given its above-average yield, steady growth, and fair payouts, HP Inc. presents a compelling opportunity for dividend-seeking investors in the technology sector. Continuous improvements in cash flow management and strategic operations further enhance its attractiveness. Hence, it is recommended for investors looking for stable income paired with future growth potential.
Smart Data Insight
Master the Perfect Entry & Exit for this Stock
Don't leave your profits to chance. Historically, this stock follows specific seasonal patterns that institutional traders use to maximize returns.
- ✅ Identify the "Golden Buying Window"
- ✅ Avoid high-risk correction cycles
- ✅ Backtested data from the last 20+ years