May 11, 2026 a 03:31 am
HPQ: Dividend Analysis - HP Inc.
HP Inc. exhibits a robust dividend profile with a substantial dividend yield of 6.39%, reflecting its strong commitment to returning capital to shareholders. The company has demonstrated steady dividend growth over the past few years, indicating its financial stability and strategic focus on sustaining shareholder value. While the payout ratios suggest efficient management of earnings and cash flows, investors should remain vigilant regarding market conditions and potential impacts on future dividends.
📊 Overview
HP Inc. maintains a strong presence in its sector, illustrated by its impressive dividend yield and long-standing history of dividend payments. This stability is further emphasized by its quality payout metrics, underscoring a solid foundation in financial management.
| Metric | Value |
|---|---|
| Sector | Technology |
| Dividend yield | 6.39% |
| Current dividend per share | 1.15 USD |
| Dividend history | 57 years |
| Last cut or suspension | None |
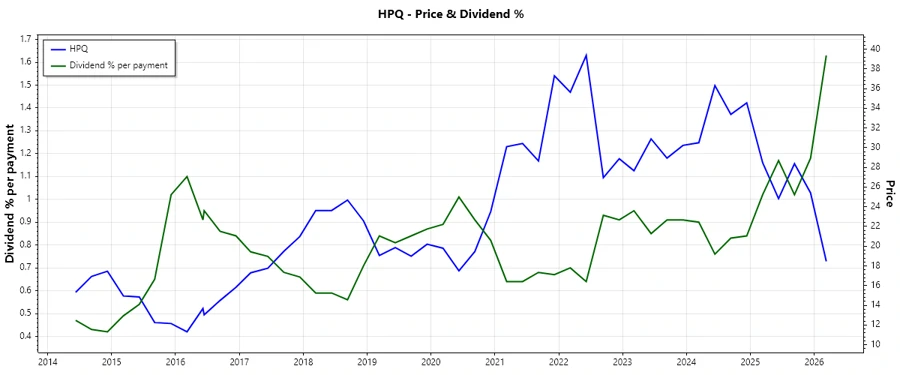
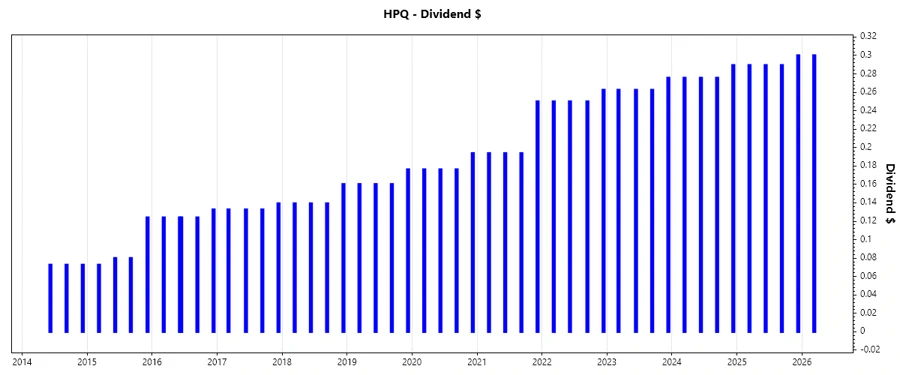
🗣️ Dividend History
The historical dividend payments reflect HP Inc.'s commitment to providing consistent returns to its investors. Long-term continuity in its dividend payments is a testament to its operational reliability and financial health. This history provides investors with confidence in the company's future dividend prospects.
| Year | Dividend per Share (USD) |
|---|---|
| 2026 | 0.30 |
| 2025 | 1.1682 |
| 2024 | 1.1162 |
| 2023 | 1.0631 |
| 2022 | 1.0125 |
📈 Dividend Growth
Evident from the data is the progressive enhancement in dividend payouts, signaling HP Inc.'s effective growth strategy and robust earnings capacity. Analyzing dividend growth allows investors to assess the company's future dividend sustainability and profitability potential.
| Time | Growth |
|---|---|
| 3 years | 4.88% |
| 5 years | 10.09% |
The average dividend growth is 10.09% over 5 years. This shows moderate but steady dividend growth.
✅ Payout Ratio
Evaluating payout ratios provides insights into HP Inc.'s ability to sustain its dividends without jeopardizing financial health. Competitive ratios suggest prudent management control.
| Key figure | Ratio |
|---|---|
| EPS-based | 42.45% |
| Free cash flow-based | 36.68% |
The relatively moderate EPS (42.45%) and FCF (36.68%) payout ratios highlight HP's controlled approach in balancing profit retention and shareholder return, suggesting dividend safety barring unforeseen financial setbacks.
Cashflow & Capital Efficiency
HP Inc.'s cashflow analysis reflects a strong capital efficiency posture, providing essential insights into its operational and growth capabilities. High yields and favorable ratios are indicative of robust financial execution.
| Metric | 2023 | 2024 | 2025 |
|---|---|---|---|
| Free Cash Flow Yield | 11.34% | 9.08% | 10.70% |
| Earnings Yield | 12.49% | 7.98% | 9.66% |
| CAPEX to Operating Cash Flow | 17.05% | 15.79% | 24.26% |
| Stock-based Compensation to Revenue | 0.82% | 0.84% | 0.94% |
| Free Cash Flow / Operating Cash Flow Ratio | 82.95% | 84.21% | 75.74% |
HP's strong cash flow management and capital efficiency suggest a well-managed operational strategy that supports sustainable growth and value generation for stakeholders.
Balance Sheet & Leverage Analysis
Analyzing HP's leverage ratios offers insight into its financial health and risk exposure. Monthly assessments enable investors to gauge stability and risk management performance.
| Metric | 2023 | 2024 | 2025 |
|---|---|---|---|
| Debt-to-Equity | -10.05 | -8.24 | -31.45 |
| Debt-to-Assets | 29.02% | 27.31% | 26.05% |
| Debt-to-Capital | 1.11 | 1.14 | 1.03 |
| Net Debt to EBITDA | 1.71 | 1.62 | 1.76 |
| Current Ratio | 0.73 | 0.72 | 0.77 |
| Quick Ratio | 0.45 | 0.45 | 0.48 |
| Financial Leverage | -34.62 | -30.17 | -120.72 |
Significant leverage indicates potential risk; however, the company's sustained interest coverage ratio and solvency metrics point to a competent debt management strategy.
Fundamental Strength & Profitability
HP's profitability metrics shed light on its operational efficiency and strategic positioning. Profit margins and return ratios enable deeper analysis of HP's profitability canvas.
| Metric | 2023 | 2024 | 2025 |
|---|---|---|---|
| Return on Equity | -3.05% | -2.10% | -7.31% |
| Return on Assets | 8.82% | 6.95% | 6.05% |
| Margins: Net | 6.07% | 5.18% | 4.57% |
| Margins: EBIT | 6.74% | 7.26% | 5.74% |
| Margins: EBITDA | 8.32% | 8.81% | 7.40% |
| Margins: Gross | 21.42% | 22.07% | 19.98% |
| Research & Development to Revenue | 2.94% | 3.06% | 2.90% |
Though some profitability metrics indicate challenges, the robustness in margin maintenance and consistent focus on innovation through R&D investment offer a counterbalance, painting a diverse profitability perspective.
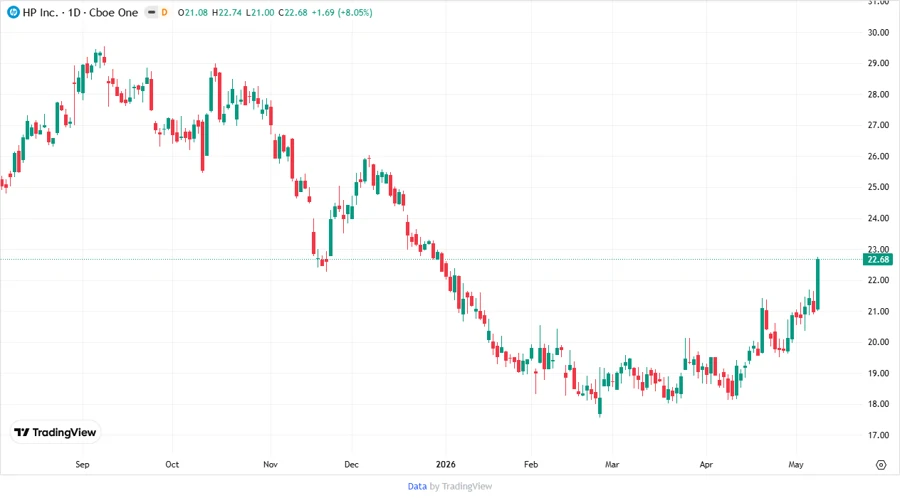
📉 Price Development
Dividend Scoring System
| Category | Score (1-5) | Score Bar |
|---|---|---|
| Dividend yield | 5 | |
| Dividend Stability | 4 | |
| Dividend growth | 3 | |
| Payout ratio | 4 | |
| Financial stability | 3 | |
| Dividend continuity | 5 | |
| Cashflow Coverage | 4 | |
| Balance Sheet Quality | 3 |
Overall Score: 31/40
Rating
In conclusion, HP Inc. presents an overall strong dividend profile that appeals to income-focused investors. With a hearty dividend yield, reliable growth patterns, and reasonable payout ratios amidst a few leverage concerns, HP Inc. remains a considerable option for those seeking a blend of current income and potential capital appreciation. It is recommended to consider HP Inc. for a diversified investment portfolio, while remaining aware of macroeconomic factors that could influence future performance.
Smart Data Insight
Master the Perfect Entry & Exit for this Stock
Don't leave your profits to chance. Historically, this stock follows specific seasonal patterns that institutional traders use to maximize returns.
- ✅ Identify the "Golden Buying Window"
- ✅ Avoid high-risk correction cycles
- ✅ Backtested data from the last 20+ years