April 14, 2026 a 07:31 am

HPQ: Dividend Analysis - HP Inc.
HP Inc. stands out for its impressive dividend history, intriguing investors with a substantial yield of over 6%. The company's consistent dividend payments over 57 years reflect its solid commitment to returning value to shareholders. Its moderate, yet steady dividend growth indicates a focus on sustainable increases, while maintaining a reasonable payout ratio.
📊 Overview
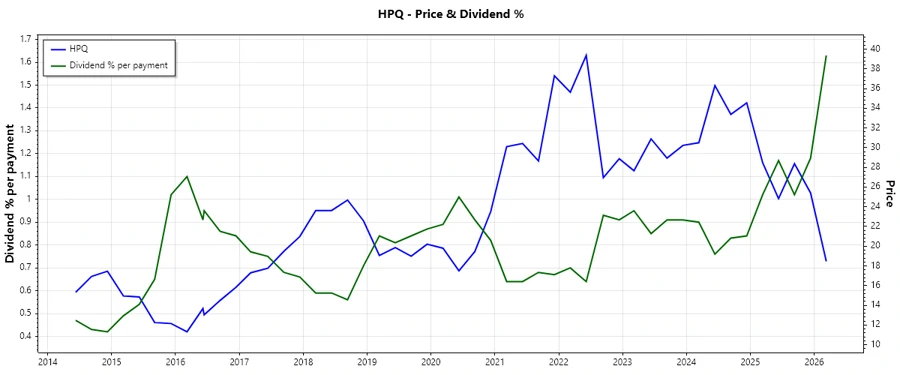
With a dividend yield of 6.39%, HP Inc. offers an attractive return for income-focused investors. The current dividend per share is $1.15 USD, supported by a steadfast 57-year dividend history and no recent cuts or suspensions, showcasing the company's dedication to shareholder returns.
| Metric | Value |
|---|---|
| Sector | Technology |
| Dividend yield | 6.39 % |
| Current dividend per share | 1.15 USD |
| Dividend history | 57 years |
| Last cut or suspension | None |
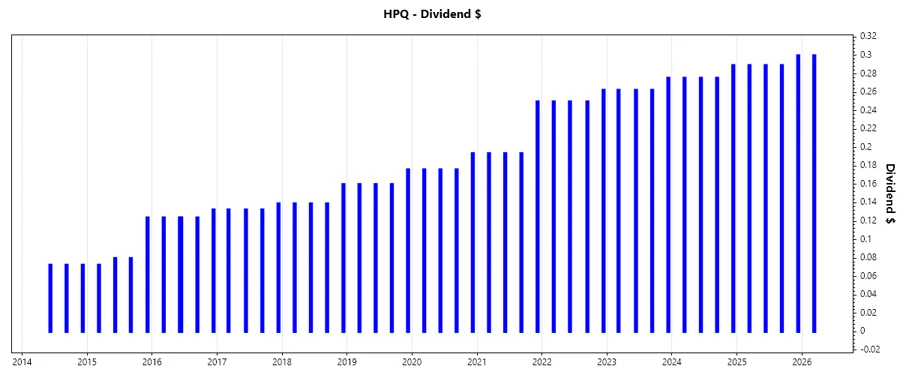
🗣️ Dividend History
The consistency in HP Inc.’s dividend payments over decades is a testament to its robust financial health, assuring investors of its capacity to generate and sustain cash flow under various economic conditions.
| Year | Dividend per Share (USD) |
|---|---|
| 2026 | 0.3 |
| 2025 | 1.1682 |
| 2024 | 1.1162 |
| 2023 | 1.0631 |
| 2022 | 1.0125 |
📈 Dividend Growth
Observing dividend growth is crucial as it highlights a company’s ability to increase shareholder returns over time without sacrificing long-term sustainability. HP Inc.'s dividend growth strategy focuses on incrementally increasing payouts.
| Time | Growth |
|---|---|
| 3 years | 4.88 % |
| 5 years | 10.09 % |
The average dividend growth is 10.09% over 5 years. This shows moderate but steady dividend growth.
📉 Payout Ratio
Payout ratios assess a company’s dividend sustainability. A lower ratio can indicate a more secure dividend with potential for future growth, while a higher ratio could imply limited flexibility.
| Key Figure | Ratio |
|---|---|
| EPS-based | 42.45 % |
| Free cash flow-based | 36.68 % |
The EPS payout ratio of 42.45% alongside a free cash flow payout of 36.68% displays HP Inc.'s ability to maintain dividends comfortably, leaving room for reinvestment and debt servicing.
✅ Cashflow & Capital Efficiency
Free cash flow, capital expenditure, and compensation metrics are critical in assessing a company’s capability to fund its operations, reinvest in growth, and reward shareholders.
| Year | 2025 | 2024 | 2023 |
|---|---|---|---|
| Free Cash Flow Yield | 10.70% | 9.08% | 11.34% |
| Earnings Yield | 9.67% | 7.98% | 12.49% |
| CAPEX to Operating Cash Flow | 24.26% | 15.79% | 17.05% |
| Stock-based Compensation to Revenue | 0.94% | 0.84% | 0.82% |
| Free Cash Flow / Operating Cash Flow Ratio | 75.74% | 84.21% | 82.95% |
With robust cash flow metrics, HP Inc. efficiently manages its capital, ensuring operational and strategic flexibility.
⚠️ Balance Sheet & Leverage Analysis
Balance sheet analysis reveals financial health, liquidity status, and the capability to meet obligations, crucial for long-term viability.
| Year | 2025 | 2024 | 2023 |
|---|---|---|---|
| Debt-to-Equity | -31.45 | -8.24 | -10.05 |
| Debt-to-Assets | 26.05% | 27.31% | 29.02% |
| Debt-to-Capital | 103.28% | 113.82% | 111.05% |
| Net Debt to EBITDA | 1.76 | 1.62 | 1.71 |
| Current Ratio | 0.77 | 0.72 | 0.73 |
| Quick Ratio | 0.48 | 0.45 | 0.45 |
HP Inc.'s balance sheet reveals a high leverage scenario with negative debt-to-equity, suggesting heavy reliance on debt which could be risky if unmitigated by operational earnings.
Fundamental Strength & Profitability
Fundamental ratios provide insight into a company’s profitability and efficiency, helping to assess its market competitiveness.
| Year | 2025 | 2024 | 2023 |
|---|---|---|---|
| Return on Equity | -7.31% | -2.10% | -3.05% |
| Return on Assets | 6.05% | 6.95% | 8.82% |
| Margins: Net | 4.57% | 5.18% | 6.07% |
| Margins: EBIT | 5.74% | 7.26% | 6.74% |
| Margins: EBITDA | 7.40% | 8.81% | 8.32% |
| Margins: Gross | 19.98% | 22.07% | 21.42% |
| Research & Development to Revenue | 2.90% | 3.06% | 2.94% |
HP Inc. demonstrates moderate profitability margins, yet negative return on equity signals challenges in generating shareholder returns, warranting strategic adjustments.
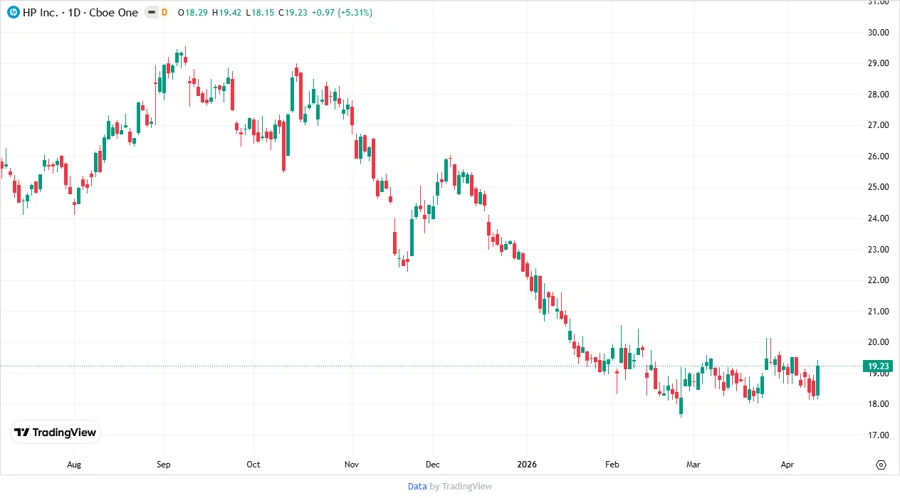
Price Development
Dividend Scoring System
| Criteria | Score | Bar |
|---|---|---|
| Dividend yield | 5 | |
| Dividend Stability | 5 | |
| Dividend growth | 3 | |
| Payout ratio | 4 | |
| Financial stability | 2 | |
| Dividend continuity | 5 | |
| Cashflow Coverage | 3 | |
| Balance Sheet Quality | 2 |
Total Score: 29/40
Rating
HP Inc. presents a compelling dividend profile with a high yield and stable history but faces challenges with its financial stability and leverage. Investors seeking income with moderate growth prospects might find it appealing, yet potential risks from leverage require vigilance.