
February 21, 2026 a 07:46 am



HPQ: Dividend Analysis - HP Inc.
HP Inc. has been a consistent performer in the Dividend sector, with a history of payouts for over 57 years. The current dividend yield of 6.34% provides a competitive edge in the market, though the historical return on equity and cash flow-based metrics suggest there is room for improvement in operational efficiency.
📊 Overview
| Metric | Value |
|---|---|
| Sector | Technology |
| Dividend yield | 6.34 % |
| Current dividend per share | 1.15 USD |
| Dividend history | 57 years |
| Last cut or suspension | None |
🗣️ Dividend History
Analyzing HP Inc.'s long dividend history offers insights into its capacity to sustain and grow shareholder returns. The company's commitment is evidenced by its uninterrupted payout for 57 years, highlighting a robust dividend policy crucial for long-term investors.
Figure 1: Historic dividend payouts illustrate consistency and growth
| Year | Dividend per Share |
|---|---|
| 2026 | 0.30 USD |
| 2025 | 1.1682 USD |
| 2024 | 1.1162 USD |
| 2023 | 1.0631 USD |
| 2022 | 1.0125 USD |
📈 Dividend Growth
Dividend growth is a vital measure of a company’s financial health and shareholder value proposition. HP Inc.'s dividend growth over the past 3 and 5 years suggests a promising outlook, reinforcing its potential for income-focused portfolios.
| Time | Growth |
|---|---|
| 3 years | 4.88 % |
| 5 years | 10.09 % |
The average dividend growth is 10.09% over 5 years. This shows moderate but steady dividend growth, a positive indicator for sustaining future payouts.
Figure 2: Dividend growth trajectory indicating upward momentum
💡 Payout Ratio
Payout ratios provide insights into the sustainability of dividend policies. The EPS-based ratio is at 42.66%, while the free cash flow-based ratio stands at 38.39%. These figures indicate a conservative payout strategy, suggesting dividend stability even in volatile periods.
| Key Figure | Ratio |
|---|---|
| EPS-based | 42.66 % |
| Free cash flow-based | 38.39 % |
📊 Cashflow & Capital Efficiency
Understanding HP Inc.’s cash flow and capital efficiency is pivotal in assessing capital allocation effectiveness. Its free cash flow yield at 16.11% and efficient CAPEX usage highlight prudent resource management and capacity for covering dividends.
| Year | Free Cash Flow Yield | Earnings Yield | CAPEX to Operating Cash Flow | Stock-based Compensation to Revenue | Free Cash Flow / Operating Cash Flow |
|---|---|---|---|---|---|
| 2025 | 10.70 % | 9.66 % | 24.26 % | 0.94 % | 75.74 % |
| 2024 | 9.08 % | 7.98 % | 15.79 % | 0.84 % | 84.21 % |
| 2023 | 11.34 % | 12.49 % | 17.05 % | 0.82 % | 82.95 % |
⚖️ Balance Sheet & Leverage Analysis
The balance sheet showcases financial solvency critical for sustaining dividends. With a negative debt-to-equity ratio, reflecting high leverage, and moderate debt-to-assets ratio, the company must manage liabilities carefully to maintain stability.
| Year | Debt-to-Equity | Debt-to-Assets | Debt-to-Capital | Net Debt to EBITDA | Current Ratio | Quick Ratio | Financial Leverage |
|---|---|---|---|---|---|---|---|
| 2025 | -31.45 | 26.05 % | 1.03 | 1.74 | 0.77 | 0.48 | -120.72 |
| 2024 | -8.24 | 27.31 % | 1.14 | 1.62 | 0.72 | 0.45 | -30.17 |
| 2023 | -10.05 | 29.02 % | 1.11 | 1.71 | 0.73 | 0.45 | -34.62 |
✅ Fundamental Strength & Profitability
HP Inc.'s margins and return indicators reflect competitive pressures but also areas for potential upside under effective strategic initiatives. The low return on equity, however, presents a challenge in effectively utilizing shareholder capital.
| Year | Return on Equity | Return on Assets | Net Margin | EBIT Margin | EBITDA Margin | Gross Margin | R&D to Revenue |
|---|---|---|---|---|---|---|---|
| 2025 | -7.31 % | 6.05 % | 4.57 % | 5.74 % | 7.40 % | 19.98 % | 2.90 % |
| 2024 | -2.10 % | 6.95 % | 5.18 % | 7.26 % | 8.81 % | 22.07 % | 3.06 % |
| 2023 | -3.05 % | 8.82 % | 6.07 % | 6.74 % | 8.32 % | 21.42 % | 2.94 % |
📉 Price Development
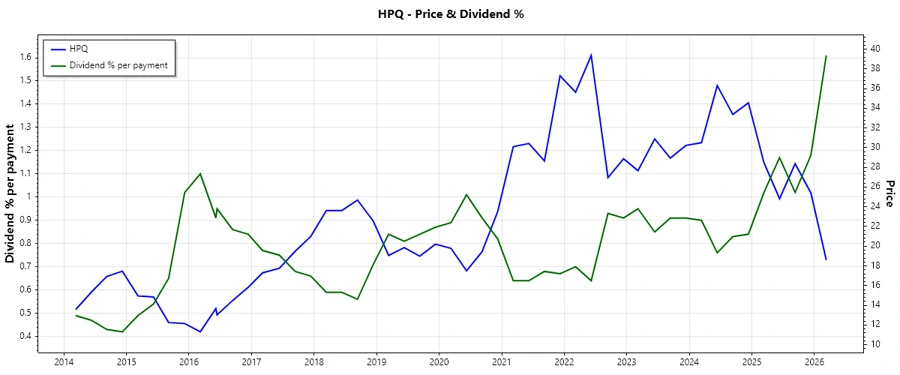
Figure 3: HP Inc.'s stock price trends reflecting market sentiments
✨ Dividend Scoring System
| Category | Score | Score Bar |
|---|---|---|
| Dividend yield | 5 | |
| Dividend Stability | 5 | |
| Dividend growth | 4 | |
| Payout ratio | 4 | |
| Financial stability | 3 | |
| Dividend continuity | 5 | |
| Cashflow Coverage | 4 | |
| Balance Sheet Quality | 3 |
Overall Score: 33/40
🏆 Rating
Based on comprehensive analysis and scoring, HP Inc. maintains a robust dividend profile characterized by high yield and continuity. However, areas such as financial stability and balance sheet quality present considerations for cautious investors. With a score of 33 out of 40, the company is a strong candidate for dividend-centric portfolios, provided other investment strategies are concurrently employed for total risk management.
Smart Data Insight
Master the Perfect Entry & Exit for this Stock
Don't leave your profits to chance. Historically, this stock follows specific seasonal patterns that institutional traders use to maximize returns.
- ✅ Identify the "Golden Buying Window"
- ✅ Avoid high-risk correction cycles
- ✅ Backtested data from the last 20+ years