October 30, 2025 a 07:32 am

HPQ: Dividend Analysis - HP Inc.
HP Inc. demonstrates a strong commitment to its dividend policy with 56 years of uninterrupted dividend payments. The steady growth in dividends highlights its capacity for incremental returns despite market challenges. Investors looking for consistent income may find HP's dividend strategy appealing. However, the negative return on equity is a concern that warrants further analysis. 📊
Overview
HP Inc., a leader in the Technology sector, has maintained a dividend yield of 4.08%, coupled with a competent current dividend per share of USD 1.10. With 56 years of dividend history and no recent cuts, HP's standing as a reliable income generator stands affirmed. 🗣️
| Metric | Value |
|---|---|
| Sector | Technology |
| Dividend yield | 4.08% |
| Current dividend per share | 1.10 USD |
| Dividend history | 56 years |
| Last cut or suspension | None |
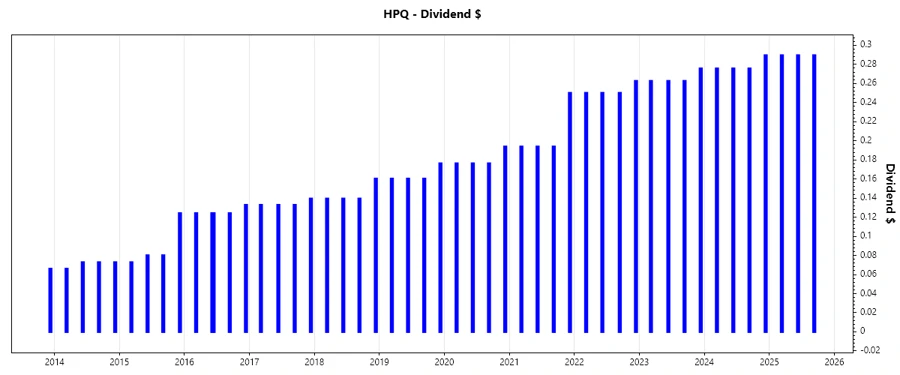
Dividend History
The extensive 56-year dividend history of HP Inc. is a testament to its capacity to distribute earnings to shareholders. This historical consistency is crucial for income-focused investors, reducing the risk of dividend suspensions. 🏦
| Year | Dividend Per Share (USD) |
|---|---|
| 2025 | 0.87 |
| 2024 | 1.12 |
| 2023 | 1.06 |
| 2022 | 1.01 |
| 2021 | 0.83 |
Dividend Growth
Tracking the dividend growth is essential for assessing a company's commitment to returning profits to shareholders. Over the past 3 and 5 years, HP Inc. has shown consistent growth in this area. 📈
| Time | Growth |
|---|---|
| 3 years | 10.32% |
| 5 years | 11.19% |
The average dividend growth is 11.19% over 5 years. This shows moderate but steady dividend growth that appeals to long-term income-seeking investors. 📈
Payout Ratio
The payout ratio is a critical measure of dividend sustainability. A lower ratio indicates a safer dividend cushion, whereas a higher ratio suggests potential instability. ⚠️
| Key Figure | Ratio |
|---|---|
| EPS-based | 39.39% |
| Free cash flow-based | 36.10% |
With an EPS-based payout ratio of 39.39% and an FCF-based ratio at 36.10%, HP Inc. provides a healthy margin for dividend sustainability, reinforcing its capacity to maintain payouts. ✅
Cashflow & Capital Efficiency
Evaluating cash flow and capital efficiency is paramount to understanding a company's operational effectiveness and its ability to cover dividends. ⚖️
| Metric | 2024 | 2023 | 2022 |
|---|---|---|---|
| Free Cash Flow Yield | 9.08% | 11.34% | 12.81% |
| Earnings Yield | 7.98% | 12.49% | 10.92% |
| CAPEX to Operating Cash Flow | 15.79% | 17.05% | 17.72% |
| Stock-based Compensation to Revenue | 0.84% | 0.81% | 0.55% |
| Free Cash Flow / Operating Cash Flow Ratio | 84.21% | 82.95% | 82.28% |
The strong free cash flow yield supports HP's financial health, ensuring continuous reinvestment and stakeholder returns. This stability is crucial for long-term investors. ✅
Balance Sheet & Leverage Analysis
A comprehensive balance sheet analysis helps assess HP's financial stability and risk management. High leverage may indicate potential risk, affecting dividend reliability. ⚠️
| Metric | 2024 | 2023 | 2022 |
|---|---|---|---|
| Debt-to-Equity | -8.24 | -10.05 | -4.06 |
| Debt-to-Assets | 27.31% | 29.02% | 31.94% |
| Debt-to-Capital | 113.82% | 111.05% | 132.64% |
| Net Debt to EBITDA | 1.62 | 1.71 | 1.67 |
| Current Ratio | 0.72 | 0.73 | 0.75 |
| Quick Ratio | 0.45 | 0.45 | 0.46 |
| Financial Leverage | -30.17 | -34.62 | -12.73 |
The elevated debt levels paired with negative debt-to-equity ratios highlight significant financial leverage, posing potential risks in volatile markets. Close monitoring is advised. ⚠️
Fundamental Strength & Profitability
Profitability insights are integral to evaluating the ability to sustain and grow dividends. Robust margins indicate efficiency and value generation. 📊
| Metric | 2024 | 2023 | 2022 |
|---|---|---|---|
| Return on Equity | -2.10% | -3.05% | -1.04% |
| Return on Assets | 6.95% | 8.82% | 8.14% |
| Net Margin | 5.18% | 6.07% | 4.98% |
| EBIT Margin | 7.26% | 6.74% | 7.44% |
| EBITDA Margin | 8.81% | 8.32% | 8.68% |
| Gross Margin | 22.07% | 21.42% | 19.49% |
| Research & Development to Revenue | 3.06% | 2.94% | 2.63% |
Despite a negative ROE, improving margins reflect HP’s operational efficiency. Strategic investment in R&D fosters innovation, potentially bolstering long-term growth and profitability. 📈
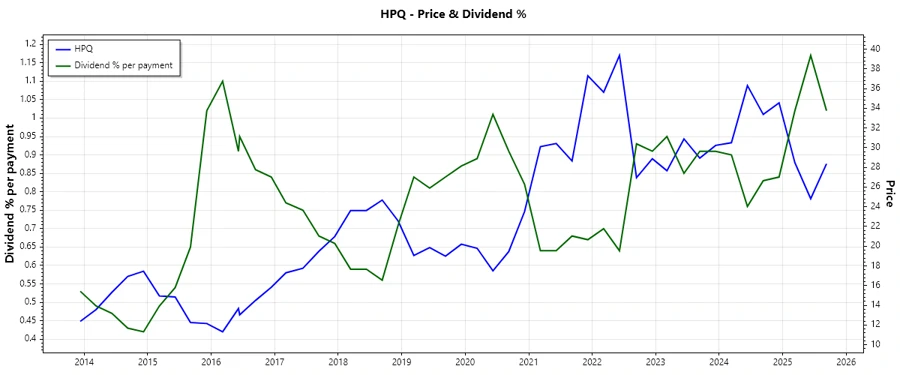
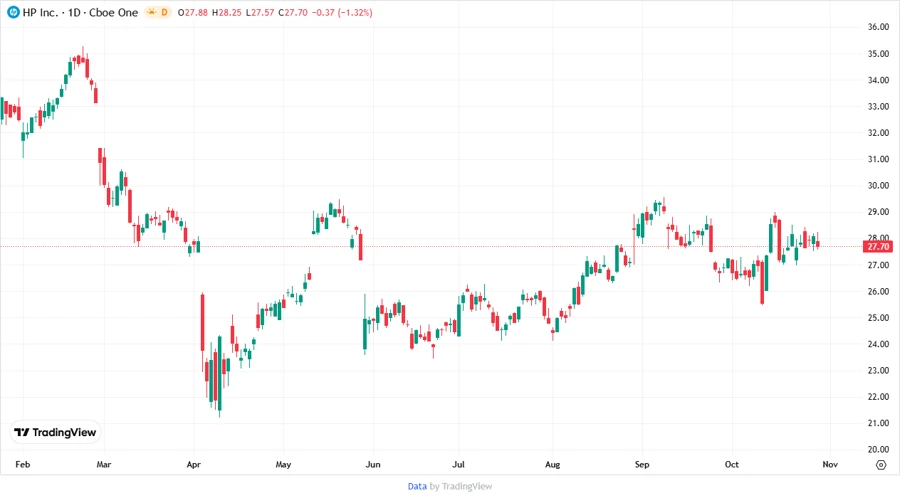
Price Development
Dividend Scoring System
| Category | Points | Score Bar |
|---|---|---|
| Dividend yield | 4 | |
| Dividend Stability | 5 | |
| Dividend growth | 3 | |
| Payout ratio | 4 | |
| Financial stability | 2 | |
| Dividend continuity | 5 | |
| Cashflow Coverage | 4 | |
| Balance Sheet Quality | 2 |
Overall Score: 29/40
Rating
Considering HP Inc.'s robust dividend history and reasonable yield, the company continues to be an attractive choice for dividend investors. However, its financial leverage and negative return on equity necessitate cautious analysis. Investors should weigh the stability of dividends against the potential risks from financial instability. Overall, HP earns a "Moderate Buy" recommendation for those prioritizing income consistency. ✅
Smart Data Insight
Master the Perfect Entry & Exit for this Stock
Don't leave your profits to chance. Historically, this stock follows specific seasonal patterns that institutional traders use to maximize returns.
- ✅ Identify the "Golden Buying Window"
- ✅ Avoid high-risk correction cycles
- ✅ Backtested data from the last 20+ years