August 19, 2025 a 07:47 am

HPQ: Dividend Analysis - HP Inc.
HP Inc. demonstrates a commitment to rewarding its investors with consistent dividends, boasting a respectable dividend yield of 4.31%. With over five decades of dividend history, the company has maintained its standing in a competitive sector. The current analysis explores the intricacies of HP's dividend profile, highlighting growth patterns and payout ratios, which suggest a balanced strategy between shareholder returns and reinvestment. The company's adherence to a stable dividend policy positions it favorably for income-driven investors.
📊 Overview
The overview delves into HP Inc.'s dividend fundamentals, providing insight into its sector performance and historical commitment to dividends.
| Key Metric | Details |
|---|---|
| Sector | Information Technology |
| Dividend yield | 4.31% |
| Current dividend per share | 1.10 USD |
| Dividend history | 56 years |
| Last cut or suspension | None |
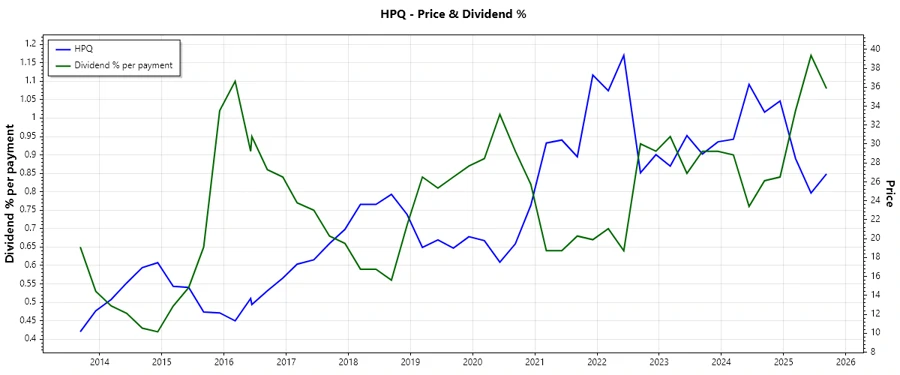
📉 Dividend History
HP Inc.'s long-standing record of dividend payments underscores its financial stability and investor appeal. Maintaining consistent dividends over 56 years reflects the company's robust cash management and commitment to its shareholders.
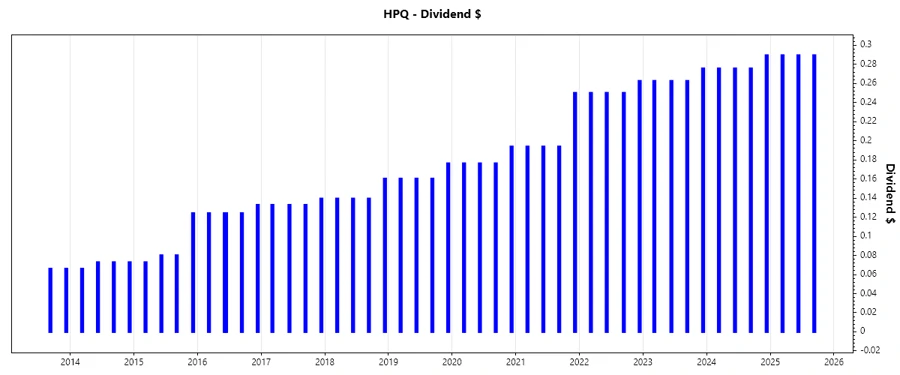
| Year | Dividend Per Share (USD) |
|---|---|
| 2025 | 0.87 |
| 2024 | 1.12 |
| 2023 | 1.06 |
| 2022 | 1.01 |
| 2021 | 0.83 |
📈 Dividend Growth
Analyzing the growth of dividends offers insights into future earning potential and optimal cash use. HP's steady increase in dividend payment demonstrates its dedication to increasing shareholder value.
| Time | Growth |
|---|---|
| 3 years | 10.32% |
| 5 years | 11.19% |
The average dividend growth is 11.19% over 5 years. This shows moderate but steady dividend growth.
✅ Payout Ratio
Payout ratios provide insight into a company's dividend sustainability and distribution strategy. They highlight the balance between income distribution and retained earnings for growth.
| Key Figure | Ratio |
|---|---|
| EPS-based | 41.44% |
| Free cash flow-based | 38.79% |
The EPS-based payout ratio of 41.44% and the FCF-based payout ratio of 38.79% indicate a disciplined payout strategy, ensuring adequate reinvestment for growth while rewarding shareholders.
💼 Cashflow & Capital Efficiency
Evaluating cash flow and capital efficiency is crucial for understanding a company's operational efficiency and investment effectiveness.
| Metric | 2024 | 2023 | 2022 |
|---|---|---|---|
| Free Cash Flow Yield | 9.08% | 11.34% | 12.81% |
| Earnings Yield | 7.98% | 12.49% | 10.92% |
| CAPEX to Operating Cash Flow | 15.79% | 17.05% | 17.72% |
| Stock-based Compensation to Revenue | 0.84% | 0.82% | 0.54% |
| Free Cash Flow / Operating Cash Flow Ratio | 84.21% | 82.95% | 82.28% |
The metrics indicate strong cash flow generation and effective capital allocation, supporting future growth prospects and improving shareholder value.
🗣️ Balance Sheet & Leverage Analysis
Understanding a company's financial leverage and balance sheet health is fundamental to evaluating its long-term solvency and risk.
| Metric | 2024 | 2023 | 2022 |
|---|---|---|---|
| Debt-to-Equity | -8.24 | -10.05 | -4.06 |
| Debt-to-Assets | 27.31% | 29.02% | 31.94% |
| Debt-to-Capital | 113.82% | 111.05% | 132.64% |
| Net Debt to EBITDA | 1.63 | 1.71 | 1.68 |
| Current Ratio | 0.72 | 0.73 | 0.75 |
| Quick Ratio | 0.45 | 0.45 | 0.46 |
| Financial Leverage | -30.17 | -34.62 | -12.73 |
The leverage ratios suggest a high level of debt relative to equity, reflecting the company's financial strategy and capital structure. Focus on maintaining debt at manageable levels is crucial for ensuring financial resilience.
🔑 Fundamental Strength & Profitability
Examining profitability metrics provides insights into operational efficiency and the ability to generate profits from company resources.
| Metric | 2024 | 2023 | 2022 |
|---|---|---|---|
| Return on Equity | -2.10% | -3.05% | -1.04% |
| Return on Assets | 6.95% | 8.82% | 8.14% |
| Margins: Net | 5.18% | 6.07% | 4.97% |
| Margins: EBIT | 7.26% | 6.74% | 7.44% |
| Margins: EBITDA | 8.78% | 8.31% | 8.66% |
| Margins: Gross | 22.07% | 21.42% | 19.58% |
| Research & Development to Revenue | 3.06% | 2.94% | 2.53% |
The profitability metrics highlight a challenging return on equity, suggesting the need for strategic improvements, while margins indicate effective cost management.
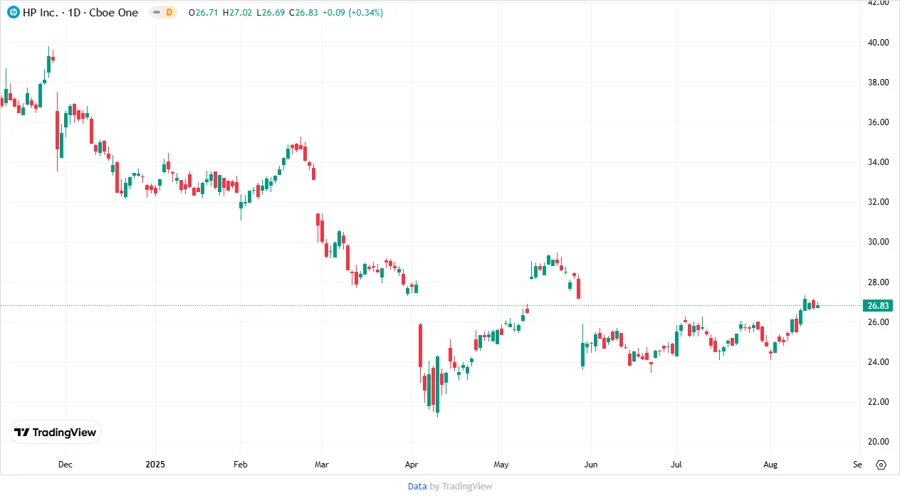
📷 Price Development
📏 Dividend Scoring System
An individualized rating system to benchmark dividend qualities: each parameter scores between 1 and 5 based on current financial performance and historical data.
| Criterion | Score | Bar |
|---|---|---|
| Dividend yield | 4 | |
| Dividend Stability | 5 | |
| Dividend growth | 4 | |
| Payout ratio | 4 | |
| Financial stability | 3 | |
| Dividend continuity | 5 | |
| Cashflow Coverage | 4 | |
| Balance Sheet Quality | 3 |
Total Score: 32/40
⭐ Rating
HP Inc. presents an attractive opportunity for dividend-focused investors, with a strong history of payments and a consistent yield. However, leverage concerns and a need for improvements in profitability metrics warrant a measured approach. Overall, HP Inc. remains a solid player in the information technology sector, balancing dividend returns with strategic growth initiatives.
Smart Data Insight
Master the Perfect Entry & Exit for this Stock
Don't leave your profits to chance. Historically, this stock follows specific seasonal patterns that institutional traders use to maximize returns.
- ✅ Identify the "Golden Buying Window"
- ✅ Avoid high-risk correction cycles
- ✅ Backtested data from the last 20+ years