October 09, 2025 a 08:15 am
HPE: Trend and Support & Resistance Analysis - Hewlett Packard Enterprise Company
The Hewlett Packard Enterprise Company appears to be showing signs of strength as the stock has experienced a bullish trend in recent months. This positive momentum has been underpinned by robust performance indicators and favorable market conditions, positioning HPE as a potentially promising investment. However, like any investment, it carries inherent risks, and ongoing market volatility could influence future trends.
Trend Analysis
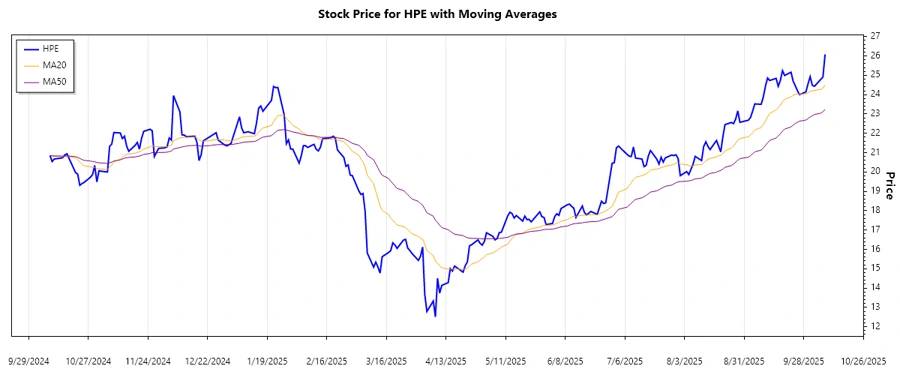
Based on the analysis of historical closing prices, the trend for Hewlett Packard Enterprise (HPE) exhibits bullish characteristics with the EMA20 outpacing the EMA50. The calculated exponential moving averages (EMA) indicate a ▲ upward trend, suggesting that the stock price is gaining momentum. Below is a table displaying the stock's performance over the last 7 days:
| Date | Close Price | Trend |
|---|---|---|
| 2025-10-08 | $26.08 | ▲ Up |
| 2025-10-07 | $24.91 | ▲ Up |
| 2025-10-06 | $24.79 | ▲ Up |
| 2025-10-03 | $24.43 | ▲ Up |
| 2025-10-02 | $24.48 | ▲ Up |
| 2025-10-01 | $24.93 | ▲ Up |
| 2025-09-30 | $24.56 | ▲ Up |
The observed upward trend suggests that investors' sentiment toward HPE is positive, potentially paving the way for further gains if this momentum is sustained.
Support and Resistance
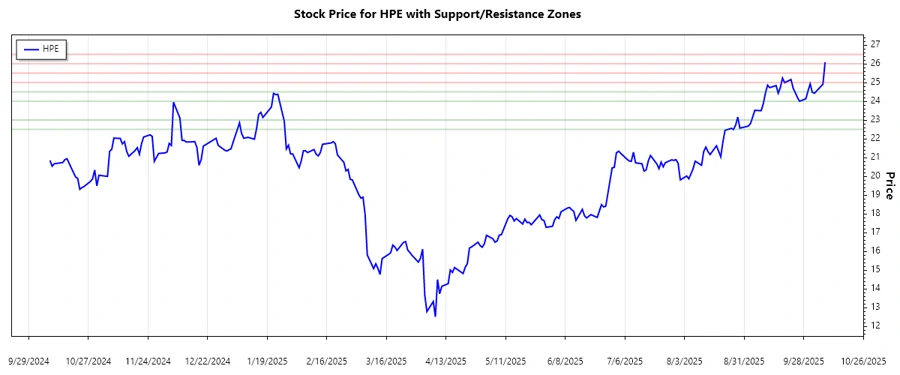
An analysis of the HPE stock price reveals key support and resistance zones defined by historical price levels. Support levels, where the price tends to stop falling, and resistance levels, where the price struggles to rise, are critical for understanding potential future movements. The following table outlines these zones:
| Zone Type | Zone |
|---|---|
| Support Zone 1 | $24.00 - $24.50 |
| Support Zone 2 | $22.50 - $23.00 |
| Resistance Zone 1 | $25.00 - $25.50 |
| Resistance Zone 2 | $26.00 - $26.50 |
The current stock price of $26.08 sits within the higher resistance zone, indicating a potential for a pullback unless new buyers step in to push prices higher.
Conclusion
The HPE stock has shown a strong upward trend supported by positive market dynamics and favorable technical indicators. While the stock is currently navigating within a critical resistance zone, indicating potential caution for investors, the overall technical pattern remains encouraging. Analysts should remain vigilant for any changes in key indicators that could signal a shift in momentum. As market conditions continue to evolve, maintaining an attentive approach will be essential for capitalizing on opportunities while managing inherent risks associated with market fluctuations.
Smart Data Insight
Master the Perfect Entry & Exit for this Stock
Don't leave your profits to chance. Historically, this stock follows specific seasonal patterns that institutional traders use to maximize returns.
- ✅ Identify the "Golden Buying Window"
- ✅ Avoid high-risk correction cycles
- ✅ Backtested data from the last 20+ years