September 14, 2025 a 08:15 am


HPE: Trend and Support & Resistance Analysis - Hewlett Packard Enterprise Company
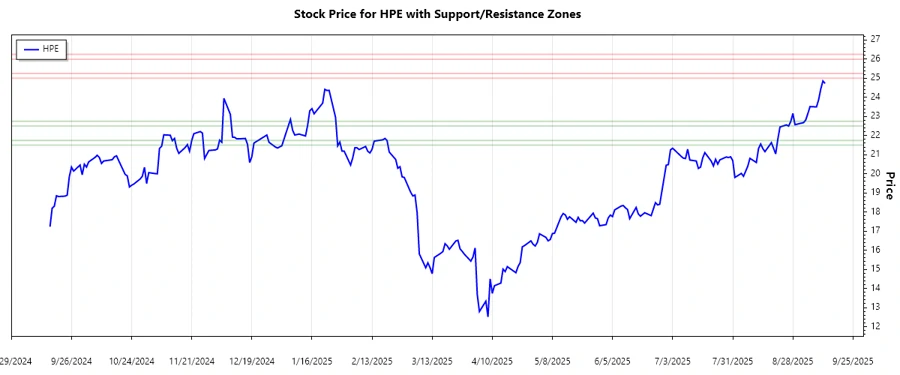
The recent data for Hewlett Packard Enterprise Company indicates a steady upward momentum in its stock prices. As the company continues to enhance its IT solutions and expands its partnerships, investors have shown confidence, reflected in the rising prices. The computation of EMAs and support/resistance levels further solidifies the technical outlook, providing a better perspective on market sentiment towards HPE.
Trend Analysis
| Date | Closing Price | Trend |
|---|---|---|
| 2025-09-12 | 24.73 | ▲ |
| 2025-09-11 | 24.86 | ▲ |
| 2025-09-10 | 24.44 | ▲ |
| 2025-09-09 | 23.88 | ▲ |
| 2025-09-08 | 23.50 | ▲ |
| 2025-09-05 | 23.52 | ▲ |
| 2025-09-04 | 23.16 | ▼ |
The calculations reveal that the EMA20 is greater than EMA50, indicating a strong upward trend. HPE has shown resilience, with prices trending higher, reflecting investor confidence in its solutions and strategic partnerships.
Support- and Resistance
| Zone Type | From | To |
|---|---|---|
| Support 1 | 21.50 | 21.75 |
| Support 2 | 22.50 | 22.75 |
| Resistance 1 | 25.00 | 25.25 |
| Resistance 2 | 26.00 | 26.25 |
The current price is near the second resistance zone, indicating a potential breakout or reversal. The HPE stock, if maintaining its upward momentum, may surpass this zone, enabling a further bullish trajectory.
Conclusion
Hewlett Packard Enterprise Company exhibits a promising technical outlook, with an established upward trend and clearly defined support/resistance zones. The upward momentum suggests a potential continuation of price increases, although caution is warranted near resistance levels. Investors should stay vigilant for breakout signals above resistance, which may imply further gains. Conversely, any failure to break through these zones may warrant reassessment of bullish positions. The synthesis of current technical indicators appeals to traders focusing on trend-following strategies.
Smart Data Insight
Master the Perfect Entry & Exit for this Stock
Don't leave your profits to chance. Historically, this stock follows specific seasonal patterns that institutional traders use to maximize returns.
- ✅ Identify the "Golden Buying Window"
- ✅ Avoid high-risk correction cycles
- ✅ Backtested data from the last 20+ years