
July 04, 2026 a 07:43 pm

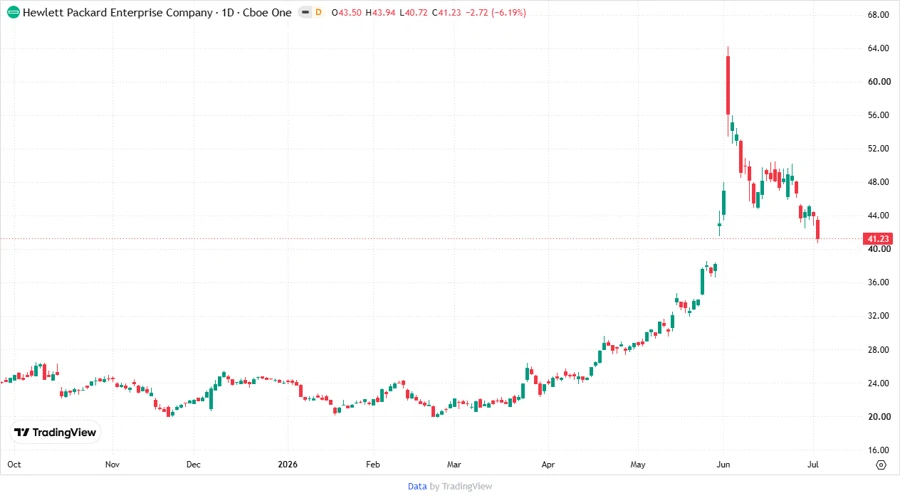
HPE: Fundamental Ratio Analysis - Hewlett Packard Enterprise Company
The Hewlett Packard Enterprise Company operates in a competitive technology sector, offering a diverse range of products and services. Its focus on data management, high-performance computing, and network solutions positions it well to support global businesses. The company's financial services arm further enhances its ability to meet customer needs with flexible solutions.
Fundamental Rating
Hewlett Packard Enterprise holds a solid overall score based on key financial metrics. While strengths are shown in some areas, there's room for improvement, particularly in debt management.
| Category | Score | Visualization |
|---|---|---|
| Discounted Cash Flow | 3 | |
| Return on Equity | 3 | |
| Return on Assets | 3 | |
| Debt to Equity | 1 | |
| Price to Earnings | 2 | |
| Price to Book | 4 |
Historical Rating
The historical performance metrics indicate consistent scoring in key areas. This stability is a positive sign for investors.
| Date | Overall | DCF | ROE | ROA | Debt to Equity | P/E | P/B |
|---|---|---|---|---|---|---|---|
| 2026-07-02 | 3 | 3 | 3 | 3 | 1 | 2 | 4 |
| Historical | 0 | 3 | 3 | 3 | 1 | 2 | 4 |
Analyst Price Targets
Analyst projections indicate a median target that suggests moderate growth potential. This aligns with current market conditions and company performance.
| High | Low | Median | Consensus |
|---|---|---|---|
| $80 | $62 | $69 | $69.27 |
Analyst Sentiment
The analyst sentiment largely leans towards a 'Hold' recommendation, although there remains a notable portion of 'Buy' ratings in place.
| Recommendation | Count | Visualization |
|---|---|---|
| Strong Buy | 0 | |
| Buy | 18 | |
| Hold | 20 | |
| Sell | 1 | |
| Strong Sell | 0 |
Conclusion
Hewlett Packard Enterprise Company presents a balanced investment opportunity with a diverse product lineup and healthy financial metrics in several key areas. The primary concern remains its debt management, which detracts from its overall score. Nevertheless, the firm's strategic positioning and analyst price targets suggest a stable outlook. Investors should consider their risk tolerance, given the market's 'Hold' consensus, and weigh potential growth against existing financial challenges.
Smart Data Insight
Master the Perfect Entry & Exit for this Stock
Don't leave your profits to chance. Historically, this stock follows specific seasonal patterns that institutional traders use to maximize returns.
- ✅ Identify the "Golden Buying Window"
- ✅ Avoid high-risk correction cycles
- ✅ Backtested data from the last 20+ years