April 19, 2026 a 04:44 pm
HPE: Fibonacci Analysis - Hewlett Packard Enterprise Company
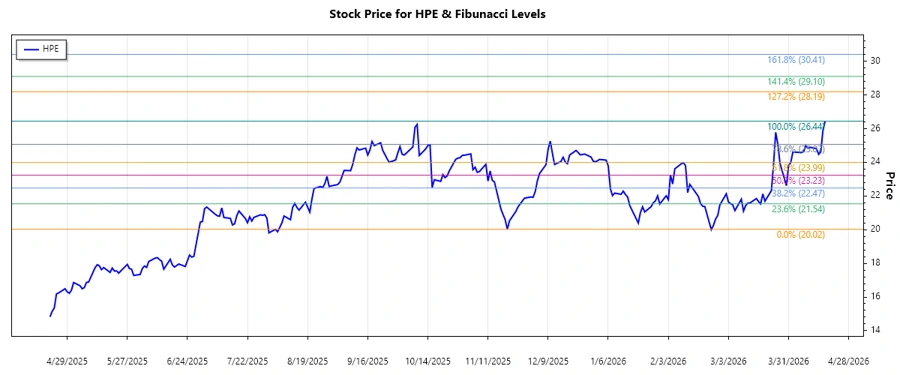
The Hewlett Packard Enterprise Company (HPE) stock has shown significant movement in recent months, indicating strong market activity. With a recent upward trajectory, this analysis explores key retracement levels that may pose potential support or resistance. HPE continues to deliver value with its technologically advanced solutions, appealing to various sectors globally.
Fibonacci Analysis
| Attributes | Details |
|---|---|
| Trend Start Date | 2025-11-20 |
| Trend End Date | 2026-04-17 |
| High Point | $26.44 (2026-04-17) |
| Low Point | $20.02 (2025-11-20) |
| Fibonacci Level | Price Level |
|---|---|
| 0.236 | $25.10 |
| 0.382 | $24.08 |
| 0.5 | $23.23 |
| 0.618 | $22.38 |
| 0.786 | $21.28 |
The current price of $26.44 is above all retracement zones, suggesting continuation of upward momentum. This indicates potential resistance at higher levels; however, should the price retreat, the identified Fibonacci levels could serve as potential support zones.
Conclusion
Hewlett Packard Enterprise (HPE) has demonstrated a notable bullish trend since the end of 2025, underpinned by the company's robust product portfolio and innovative approaches. The upward trend suggests strong investor confidence, likely fueled by strategic initiatives and partnerships. If HPE sustains its growth momentum and breaks above resistance levels, further upside potential could materialize. However, investors should keep an eye on any macroeconomic challenges that may influence the stock's performance. Overall, continued monitoring of key Fibonacci retracement levels can provide insights into possible future movements for both short-term traders and long-term investors.