
July 12, 2026 a 07:31 am


HPE: Dividend Analysis - Hewlett Packard Enterprise Company
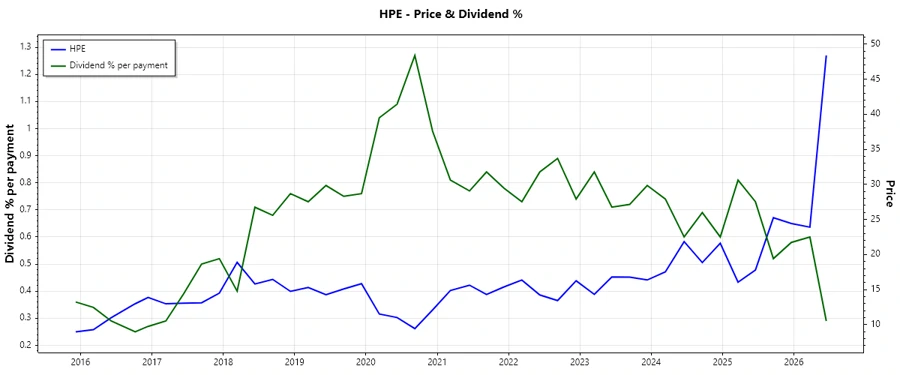
Hewlett Packard Enterprise Company (HPE) presents a robust dividend profile backed by its resilience within the technology sector. Currently offering a dividend yield of 1.15%, with a history spanning over 12 years, HPE demonstrates a commitment to shareholder returns. The company showcases potential growth reflective in its favorable dividend growth over both the three and five-year horizons.
Overview
Hewlett Packard Enterprise Company is a key player in the Information Technology sector. With a market capitalization of $64.22 Billion, HPE is a significant entity driving innovation and digital transformation. Below is an overview of its current dividend metrics.
| Metric | Details |
|---|---|
| Sector | Information Technology |
| Dividend yield | 1.15 % |
| Current dividend per share | 0.60 USD |
| Dividend history | 12 years |
| Last cut or suspension | None |
Dividend History
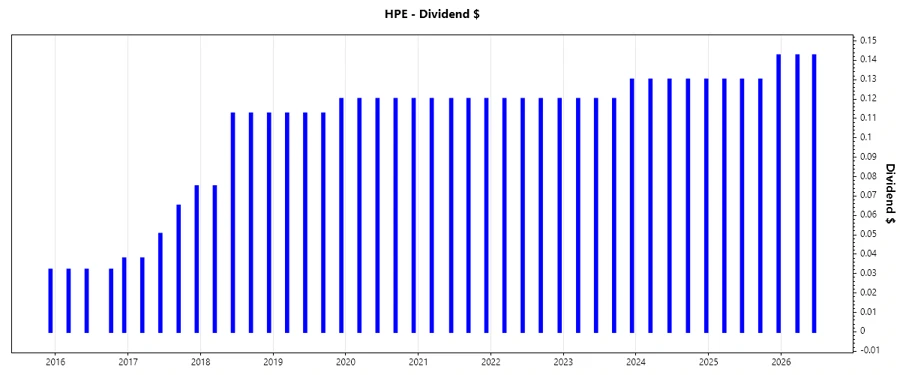
HPE has maintained a consistent dividend history, demonstrating the company's financial stability and commitment to its shareholders. Here are the recent dividends distributed over the last five years.
| Year | Dividend Per Share (USD) |
|---|---|
| 2026 | 0.2850 |
| 2025 | 0.5325 |
| 2024 | 0.52 |
| 2023 | 0.49 |
| 2022 | 0.48 |
Dividend Growth
Dividend growth is a critical indicator of a company's potential to enhance shareholder value over time. HPE's dividend growth profile is reflective of its strategic financial positioning and reinvestment policies.
| Time | Growth |
|---|---|
| 3 years | 3.52 % |
| 5 years | 2.10 % |
The average dividend growth is 2.10 % over 5 years. This shows moderate but steady dividend growth.
Payout Ratio
A careful analysis of payout ratios is essential to ensuring that dividend distributions remain sustainable over the long term. HPE demonstrates a prudent approach with substantial room for adjustment if needed.
| Key Figure | Ratio |
|---|---|
| EPS-based | 52.87 % |
| Free cash flow-based | 14.12 % |
The EPS payout ratio is relatively moderate at 52.87 % suggesting a balanced approach. The low FCF payout ratio of 14.12 % ensures dividend payments are easily covered by free cash flow, enhancing sustainability.
Cashflow & Capital Efficiency
Financial health is significantly determined by an entity’s cash flow stability and capital efficiency. HPE's current figures underscore its operational effectiveness and efficient capital deployment strategies.
| Year | 2023 | 2024 | 2025 |
|---|---|---|---|
| Free Cash Flow Yield (%) | 8.01 | 7.73 | 1.94 |
| Earnings Yield (%) | 10.14 | 10.11 | 0.18 |
| CAPEX to Operating Cash Flow | 0.639 | 0.545 | 0.785 |
| Stock Compensation / Revenue | 0.0147 | 0.0143 | 0.0187 |
| Free Cash Flow / Operating Cash Flow | 0.361 | 0.455 | 0.215 |
The cash flow yields suggest robust free cash flow generation in recent operational years, with strategic reinvestments contributing positively to capital efficiency.
Balance Sheet & Leverage Analysis
Continually evaluating leverage and liquidity is essential to ensuring long-term financial sustainability. HPE maintains a stable balance sheet with optimal leverage usage and liquidity measures.
| Year | 2023 | 2024 | 2025 |
|---|---|---|---|
| Debt-to-Equity Ratio | 0.638 | 0.799 | 0.975 |
| Debt-to-Assets Ratio | 0.236 | 0.278 | 0.317 |
| Debt-to-Capital Ratio | 0.390 | 0.444 | 0.494 |
| Net Debt to EBITDA | 1.908 | 0.893 | 6.968 |
| Current Ratio | 0.866 | 1.288 | 1.014 |
| Quick Ratio | 0.655 | 0.987 | 0.756 |
HPE demonstrates solid financial stability with those debt ratios, allowing for sufficient headroom maneuverability amid varying economic conditions.
Fundamental Strength & Profitability
Assessing fundamental strengths and profitability margins allows for an in-depth understanding of core business efficiencies. HPE shows consistent profitability amidst sector inclines.
| Year | 2023 | 2024 | 2025 |
|---|---|---|---|
| Return on Equity (%) | 9.56 | 10.39 | 0.23 |
| Return on Assets (%) | 3.54 | 3.62 | 0.08 |
| Net Margin | 0.0696 | 0.0858 | 0.0017 |
| EBIT Margin | 0.0766 | 0.0997 | -0.0032 |
| EBITDA Margin | 0.1665 | 0.1850 | 0.0766 |
| Gross Margin | 0.3409 | 0.3177 | 0.2877 |
| R&D / Revenue | 0.081 | 0.075 | 0.073 |
Profitability remains robust, enhanced by optimized practices that yield favorable operational margins despite competitive pressures.
Price Development
Dividend Scoring System
| Criteria | Score (1-5) | |
|---|---|---|
| Dividend yield | 3 | |
| Dividend Stability | 4 | |
| Dividend growth | 3 | |
| Payout ratio | 4 | |
| Financial stability | 4 | |
| Dividend continuity | 5 | |
| Cashflow Coverage | 5 | |
| Balance Sheet Quality | 4 |
Total Score: 32/40
Rating
Hewlett Packard Enterprise Company exhibits a comprehensive and sustainable dividend profile. With commendable financial stability and an established dividend history, HPE remains a viable option for income-focused investors seeking reliable dividend yields combined with a moderate growth trajectory.
Smart Data Insight
Master the Perfect Entry & Exit for this Stock
Don't leave your profits to chance. Historically, this stock follows specific seasonal patterns that institutional traders use to maximize returns.
- ✅ Identify the "Golden Buying Window"
- ✅ Avoid high-risk correction cycles
- ✅ Backtested data from the last 20+ years