
April 23, 2026 a 03:31 pm
HPE: Dividend Analysis - Hewlett Packard Enterprise Company
Hewlett Packard Enterprise Company (HPE) exhibits a compelling dividend profile with a yield of 2.28%, underpinned by a consistent 12-year dividend history. Despite recent financial headwinds, its dividend strategy remains largely intact, highlighting a commitment to shareholder returns. The company's strong market position in the technology sector and commitment to innovation underpin the sustainability of dividends. However, analyzing payout ratios and cash flow efficiencies is crucial to understanding future dividend potential.
📊 Overview
| Metric | Value |
|---|---|
| Sector | Technology |
| Dividend Yield | 2.28 % |
| Current Dividend Per Share | 0.60 USD |
| Dividend History | 12 years |
| Last Cut or Suspension | None |
📈 Dividend History
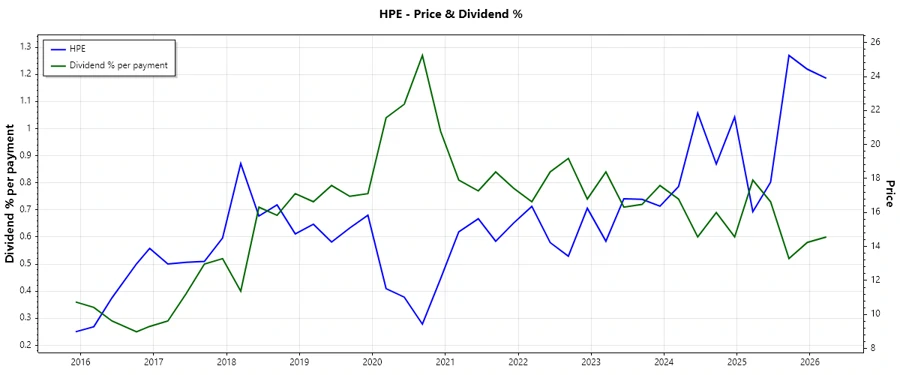
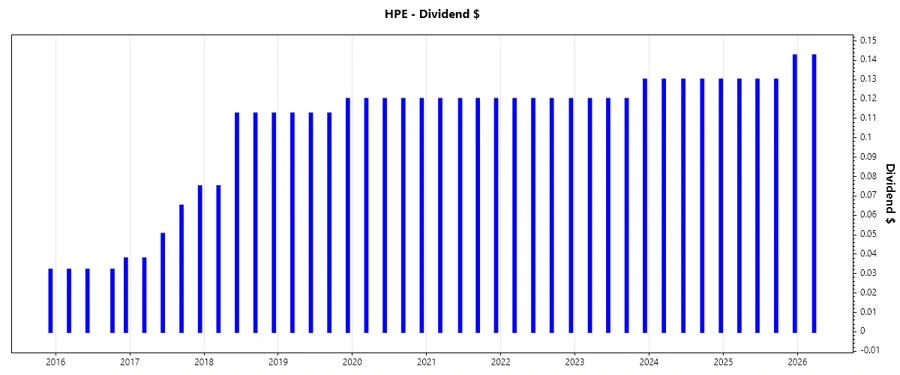
The historical dividend payouts signify HPE's stable commitment to its shareholders. A robust dividend history not only reflects financial health but also builds investor confidence.
| Year | Dividend Per Share (USD) |
|---|---|
| 2026 | 0.1425 |
| 2025 | 0.5325 |
| 2024 | 0.52 |
| 2023 | 0.49 |
| 2022 | 0.48 |
📈 Dividend Growth
Dividend growth serves as an indicator of future income potential and a company’s capacity to increase shareholder value.
| Time Period | Growth |
|---|---|
| 3 years | 3.52 % |
| 5 years | 2.10 % |
The average dividend growth is 2.10% over 5 years. This shows moderate but steady dividend growth.
⚖️ Payout Ratio
Payout ratios offer insights into how sustainable a company’s dividend payments are, which is vital for assessing financial health.
| Key Figure | Ratio |
|---|---|
| EPS-based | -514.11 % |
| Free Cash Flow-based | 20.99 % |
The EPS-based payout ratio suggests unsustainable dividend distribution relative to current earnings, whereas the FCF-based ratio indicates ample cash coverage for dividends.
💰 Cashflow & Capital Efficiency
Understanding cash flow and capital efficiency offers a window into a firm's financial operations and investment productivity.
| Metric | 2025 | 2024 | 2023 |
|---|---|---|---|
| Free Cash Flow Yield | 1.94% | 7.74% | 8.01% |
| Earnings Yield | 0.18% | 10.11% | 10.14% |
| CAPEX to Operating Cash Flow | 78.52% | 54.53% | 63.87% |
| Stock-based Compensation to Revenue | 1.87% | 1.43% | 1.47% |
| Free Cash Flow / Operating Cash Flow Ratio | 21.48% | 45.47% | 36.13% |
The data indicates a stable cash flow, providing a sound foundation for capital investments and future dividend commitments.
📈 Balance Sheet & Leverage Analysis
A comprehensive analysis of the balance sheet reveals the financial leverage and liquidity, critical for assessing long-term viability.
| Metric | 2025 | 2024 | 2023 |
|---|---|---|---|
| Debt-to-Equity | 0.91 | 0.80 | 0.64 |
| Debt-to-Assets | 29.46% | 27.81% | 23.65% |
| Debt-to-Capital | 47.53% | 44.40% | 38.95% |
| Net Debt to EBITDA | 8.85 | 0.89 | 1.91 |
| Current Ratio | 1.01 | 1.29 | 0.87 |
| Quick Ratio | 0.76 | 0.99 | 0.66 |
| Financial Leverage | 3.07 | 2.87 | 2.70 |
HPE maintains robust financial leverage and liquidity, indicative of sound debt management and liquidity reserves.
🗣️ Fundamental Strength & Profitability
Fundamental metrics are pivotal in evaluating the overall profitability and operational efficiency of a company.
| Metric | 2025 | 2024 | 2023 |
|---|---|---|---|
| Return on Equity | 0.23% | 10.39% | 9.56% |
| Return on Assets | 0.08% | 3.62% | 3.54% |
| Return on Invested Capital | -0.59% | 4.23% | 5.43% |
| Margins: Net | 0.17% | 8.58% | 6.96% |
| Margins: EBIT | -0.32% | 9.97% | 7.66% |
| Margins: EBITDA | 7.66% | 18.50% | 16.65% |
| Margins: Gross | 28.77% | 31.77% | 34.09% |
| R&D to Revenue | 7.79% | 7.47% | 8.07% |
The data highlights a strong emphasis on R&D with consistent profitability metrics, although 2025 sees a slight dip in returns on investments.
💹 Price Development
🌟 Dividend Scoring System
| Criteria | Score | Visualization |
|---|---|---|
| Dividend Yield | 3 | |
| Dividend Stability | 4 | |
| Dividend Growth | 2 | |
| Payout Ratio | 2 | |
| Financial Stability | 4 | |
| Dividend Continuity | 5 | |
| Cashflow Coverage | 3 | |
| Balance Sheet Quality | 4 |
Overall Score: 27 out of 40
✅ Rating
In summary, Hewlett Packard Enterprise exhibits a moderate dividend yield with a commendable history of stability and continuity. However, challenges in the EPS payout ratio demonstrate caution in growth expectations. Market position and fiscal policies bolster financial stability, suggesting a moderate confidence level in future dividend payments. Investors seeking a balanced approach in stable sectors may find HPE a viable option, while being mindful of earnings volatility.
Smart Data Insight
Master the Perfect Entry & Exit for this Stock
Don't leave your profits to chance. Historically, this stock follows specific seasonal patterns that institutional traders use to maximize returns.
- ✅ Identify the "Golden Buying Window"
- ✅ Avoid high-risk correction cycles
- ✅ Backtested data from the last 20+ years