
March 09, 2026 a 07:46 am
HPE: Dividend Analysis - Hewlett Packard Enterprise Company
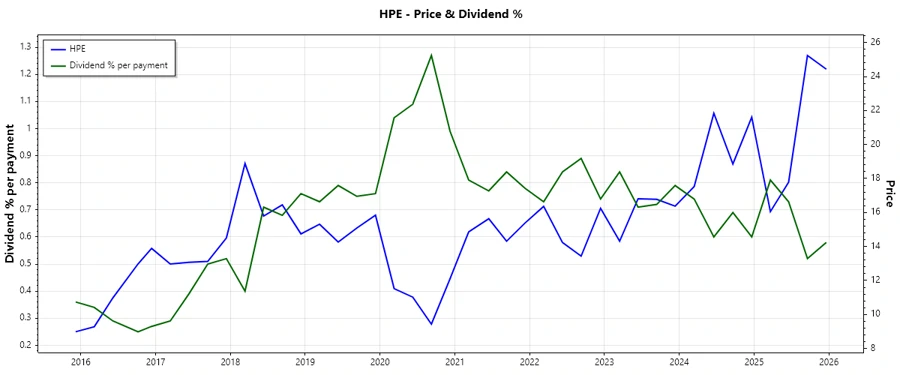
Hewlett Packard Enterprise, with a stable dividend history of 11 years, showcases resilience in a competitive sector. The company's dividend growth over both 3 and 5 years highlights its commitment to returning capital to shareholders. However, its elevated EPS-based payout ratio suggests caution and requires close monitoring of earnings stability and financial policies.
Overview 📊
The following summarizes key dividend metrics for Hewlett Packard Enterprise, providing a snapshot of its dividend yield, history, and sector context.
| Metric | Value |
|---|---|
| Sector | Technology |
| Dividend Yield | 2.18% |
| Current Dividend per Share | 0.60 USD |
| Dividend History | 11 years |
| Last Cut or Suspension | None |
Dividend History 📈
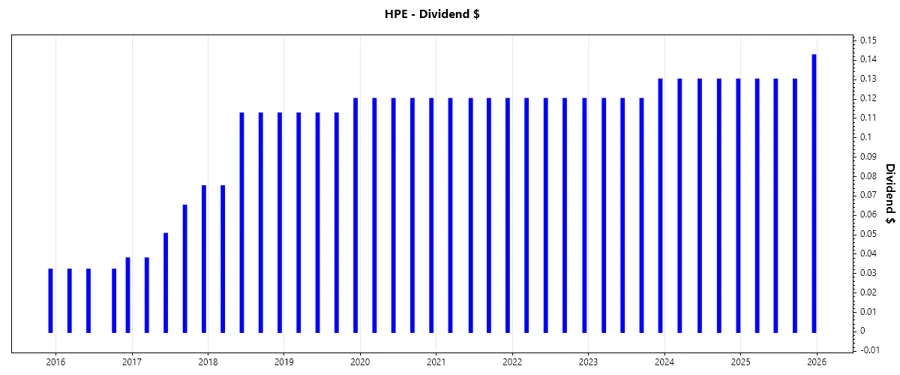
The historical progression of dividends offers insight into Hewlett Packard Enterprise’s commitment to shareholder wealth. A consistent dividend history can indicate financial health and disciplined payout practices.
| Year | Dividend per Share (USD) |
|---|---|
| 2025 | 0.5325 |
| 2024 | 0.52 |
| 2023 | 0.49 |
| 2022 | 0.48 |
| 2021 | 0.48 |
Dividend Growth 📈
Dividend growth is crucial for both income investors and those seeking total return. It reflects a company's ability to increase cash distributions over time, often mirroring business growth and sustainability.
| Time | Growth |
|---|---|
| 3 years | 3.52% |
| 5 years | 2.10% |
The average dividend growth is 2.10% over 5 years. This shows moderate but steady dividend growth.
Payout Ratio ⚠️
Payout ratios determine dividend sustainability and future growth potential. A high EPS-based ratio can indicate risk if it surpasses earnings.
| Key Figure | Ratio |
|---|---|
| EPS-based | 1396.49% |
| Free Cash Flow-based | 35.22% |
The EPS-based payout ratio of 1396.49% indicates a potential unsustainability if it consistently exceeds 100%, while the FCF-based ratio is more conservative at 35.22%.
Cashflow & Capital Efficiency 💼
Examining free cash flow generation and capital allocation strategies provide insights into a firm's operational effectiveness and investment acumen.
| Metric | 2023 | 2024 | 2025 |
|---|---|---|---|
| Free Cash Flow Yield | 8.08% | 7.74% | 1.94% |
| Earnings Yield | 0.20% | 10.11% | 0.18% |
| CAPEX to Operating Cash Flow | 21.96% | 54.53% | 78.52% |
| Stock-based Compensation to Revenue | 1.30% | 1.43% | 1.87% |
| Free Cash Flow / Operating Cash Flow Ratio | 21.48% | 45.47% | 21.48% |
The cash flow stability and efficiency show a diverse application of free cash flow, albeit declining efficiency in the latest year.
Balance Sheet & Leverage Analysis 📊
Balance sheet strength and leverage ratios are critical in assessing financial risk and liquidity. Leverage ratios in particular provide insights into capital structure risk.
| Metric | 2023 | 2024 | 2025 |
|---|---|---|---|
| Debt-to-Equity | 0.64 | 0.80 | 0.91 |
| Debt-to-Assets | 0.24 | 0.28 | 0.29 |
| Debt-to-Capital | 0.39 | 0.44 | 0.48 |
| Net Debt to EBITDA | 1.91 | 0.89 | 6.32 |
| Current Ratio | 0.87 | 1.29 | 1.01 |
| Quick Ratio | 0.66 | 0.99 | 0.76 |
| Financial Leverage | 2.70 | 2.87 | 3.07 |
The company's leverage ratios suggest an increasing reliance on debt, necessitating vigilance in ensuring financial stability.
Fundamental Strength & Profitability 🏅
Reviewing profitability and fundamental strengths underscores operational effectiveness and competitive positioning.
| Metric | 2023 | 2024 | 2025 |
|---|---|---|---|
| Return on Equity | 9.56% | 10.39% | 0.23% |
| Return on Assets | 3.54% | 3.62% | 0.08% |
| Margins: Net | 6.96% | 8.58% | 0.17% |
| Margins: EBIT | 7.66% | 9.97% | -0.32% |
| Margins: EBITDA | 16.65% | 18.50% | 7.66% |
| Margins: Gross | 34.09% | 31.77% | 28.77% |
| Research & Development to Revenue | 8.07% | 7.47% | 7.34% |
Hewlett Packard Enterprise maintains its competitive position with solid profitability margins, especially in R&D, underscoring innovation focus.
Price Development 📊
Dividend Scoring System 🗣️
| Category | Score | Indicator |
|---|---|---|
| Dividend Yield | 3 | |
| Dividend Stability | 4 | |
| Dividend Growth | 3 | |
| Payout Ratio | 2 | |
| Financial Stability | 3 | |
| Dividend Continuity | 4 | |
| Cashflow Coverage | 3 | |
| Balance Sheet Quality | 3 |
Total Score: 25/40
Rating ✅
Hewlett Packard Enterprise's dividend profile appears satisfactory with respectable continuity and growth rates. However, the elevated payout ratio calls for prudent financial management. Overall, this stock could fit well within a diversified income-focused portfolio, especially where dividend stability is favored over yield.
Smart Data Insight
Master the Perfect Entry & Exit for this Stock
Don't leave your profits to chance. Historically, this stock follows specific seasonal patterns that institutional traders use to maximize returns.
- ✅ Identify the "Golden Buying Window"
- ✅ Avoid high-risk correction cycles
- ✅ Backtested data from the last 20+ years