August 03, 2025 a 03:31 pm

HPE: Dividend Analysis - Hewlett Packard Enterprise Company
Hewlett Packard Enterprise, with a significant presence in the technology sector, offers a sustainable dividend yield reflecting its strong financial health. Its commitment to shareholder value is evident in its consistent dividend history and stable growth strategies.
Overview 📊
The following table provides an overview of the key dividend metrics for Hewlett Packard Enterprise:
| Metric | Value |
|---|---|
| Sector | Technology |
| Dividend yield | 2.92% |
| Current dividend per share | 0.516 USD |
| Dividend history | 11 years |
| Last cut or suspension | None |
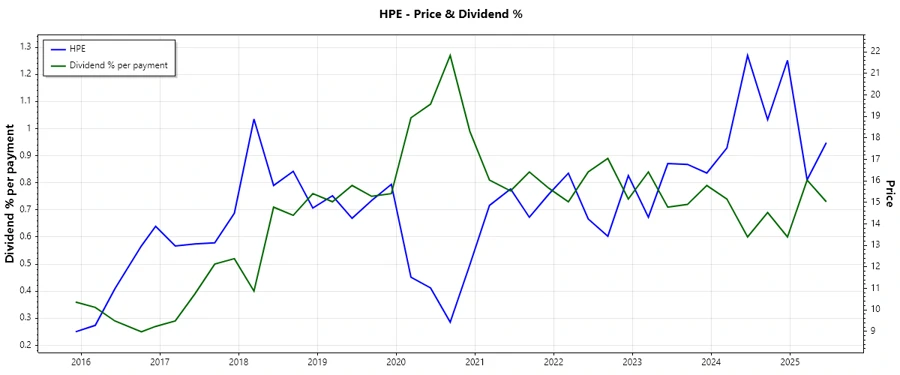
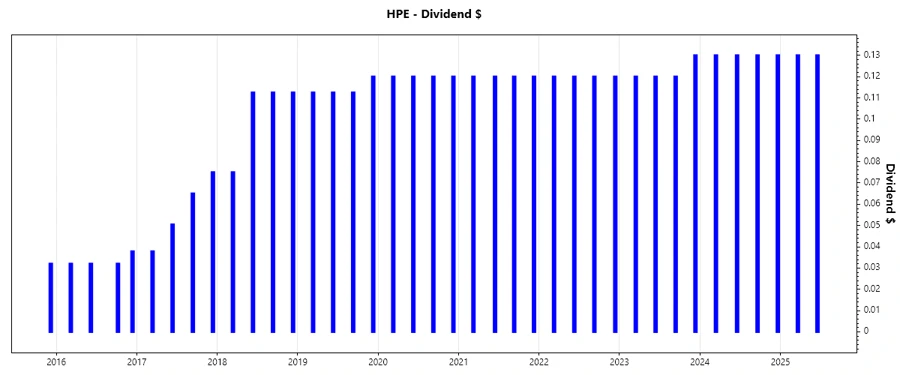
Dividend History 🗣️
Understanding the history of dividends provides insights into the company's commitment to returning value to shareholders. Here's how Hewlett Packard Enterprise has performed:
| Year | Dividend per share (USD) |
|---|---|
| 2025 | 0.26 |
| 2024 | 0.52 |
| 2023 | 0.49 |
| 2022 | 0.48 |
| 2021 | 0.48 |
Dividend Growth 📈
Dividend growth signals the company's financial health and commitment to increasing shareholder returns. Here's a look at its growth trajectory:
| Time | Growth |
|---|---|
| 3 years | 2.70% |
| 5 years | 2.59% |
The average dividend growth is 2.59% over 5 years. This shows moderate but steady dividend growth.
Payout Ratio 🔄
The payout ratios are essential for assessing the sustainability of dividends. An analysis of these ratios helps in understanding the company's ability to maintain its dividend payouts:
| Key Figure | Ratio |
|---|---|
| EPS-based | 47.88% |
| Free cash flow-based | 633.33% |
With an EPS payout of 47.88%, HPE maintains a balanced approach to profitability and shareholder returns. However, a high FCF ratio indicates potential cash flow constraints.
Cashflow & Capital Efficiency 🏦
Assessing cash flow metrics is crucial in evaluating a company's financial flexibility and capital efficiency:
| Year | 2024 | 2023 | 2022 |
|---|---|---|---|
| Free Cash Flow Yield | 7.74% | 8.01% | 7.91% |
| Earnings Yield | 10.11% | 10.14% | 4.67% |
| CAPEX/Operating Cash Flow | 54.53% | 63.87% | 67.97% |
| Stock-based Compensation/Revenue | 1.43% | 1.47% | 1.37% |
| Free Cash Flow/Operating Cash Flow | 45.47% | 36.13% | 32.03% |
HPE shows reliable cash flow generation and efficient capital allocation, with a focus on maintaining robust operations despite high cash flow payout ratios.
Balance Sheet & Leverage Analysis 📉
Analysis of leverage and liquidity ratios provides a comprehensive view of a company's financial risk and stability:
| Year | 2024 | 2023 | 2022 |
|---|---|---|---|
| Debt-to-Equity Ratio | 0.74 | 0.64 | 0.63 |
| Debt-to-Assets Ratio | 0.26 | 0.24 | 0.22 |
| Debt-to-Capital Ratio | 0.42 | 0.39 | 0.39 |
| Net Debt to EBITDA | 0.68 | 1.83 | 1.74 |
| Current Ratio | 1.29 | 0.87 | 0.88 |
| Quick Ratio | 0.99 | 0.66 | 0.66 |
| Financial Leverage | 2.87 | 2.70 | 2.88 |
Despite moderate leverage, HPE's strong interest coverage hints at sufficient liquidity to manage its obligations.
Fundamental Strength & Profitability ✅
These metrics provide insights into a company's operational efficiency and profitability:
| Year | 2024 | 2023 | 2022 |
|---|---|---|---|
| Return on Equity | 10.39% | 9.56% | 4.37% |
| Return on Assets | 3.62% | 3.54% | 1.52% |
| Net Margin | 8.56% | 6.95% | 3.05% |
| EBIT Margin | 8.28% | 8.38% | 7.82% |
| Gross Margin | 32.68% | 35.14% | 33.36% |
| R&D/Revenue | 7.46% | 8.06% | 7.18% |
HPE’s solid return metrics reflect effective management and operational efficiency, further validated by competitive margins across key areas.
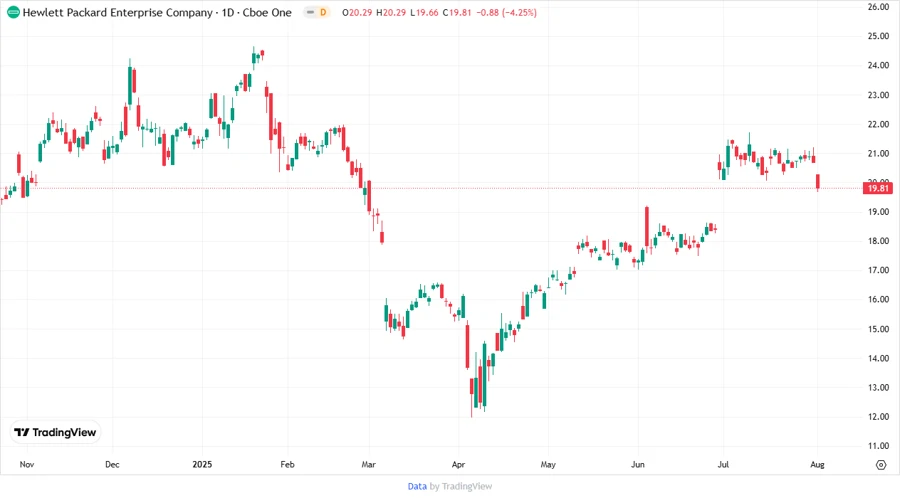
Price Development 📈
Dividend Scoring System 📊
| Category | Score (1-5) | |
|---|---|---|
| Dividend Yield | 4 | |
| Dividend Stability | 5 | |
| Dividend Growth | 3 | |
| Payout Ratio | 2 | |
| Financial Stability | 3 | |
| Dividend Continuity | 5 | |
| Cashflow Coverage | 3 | |
| Balance Sheet Quality | 4 |
Total Score: 29/40
Rating 🏆
Hewlett Packard Enterprise demonstrates a solid dividend profile with a strong history of stability. While payout ratios, particularly FCF-based, may warrant attention, its operational efficiency and robust financial metrics support the company's reputation as a reliable dividend payer. Overall, HPE is a sound investment for dividend-conscious investors, providing both stability and modest growth potential.
Smart Data Insight
Master the Perfect Entry & Exit for this Stock
Don't leave your profits to chance. Historically, this stock follows specific seasonal patterns that institutional traders use to maximize returns.
- ✅ Identify the "Golden Buying Window"
- ✅ Avoid high-risk correction cycles
- ✅ Backtested data from the last 20+ years