May 12, 2026 a 06:00 pm

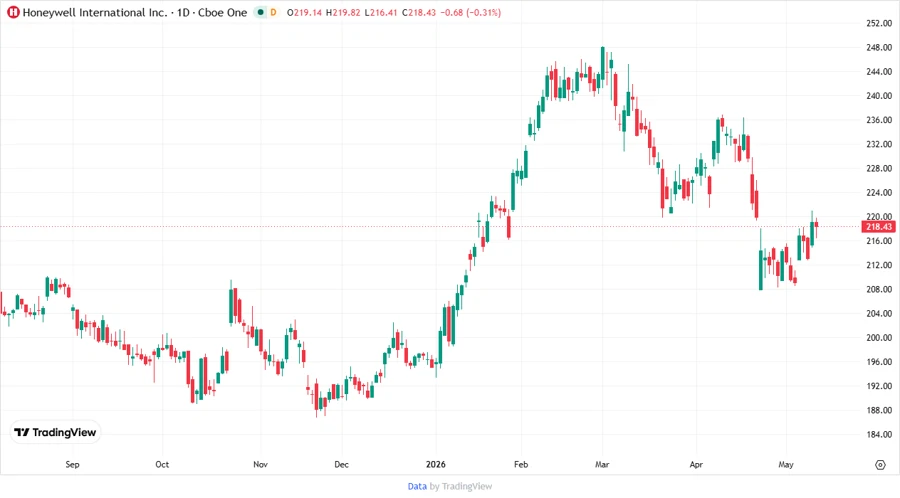
HON: Fundamental Ratio Analysis - Honeywell International Inc.
Honeywell International Inc., a leader in diversified technology and manufacturing, demonstrates robust business operations across multiple industrial segments. Despite global challenges, its comprehensive portfolio helps in maintaining consistent growth and innovation. The stock shows potential for long-term value through strategic advancements and market penetration.
Fundamental Rating
Honeywell's fundamentals reveal a balanced scorecard approach, highlighting its financial resilience and market appeal.
| Category | Score | Visual Representation |
|---|---|---|
| Discounted Cash Flow | 4 | |
| Return on Equity | 5 | |
| Return on Assets | 4 | |
| Debt to Equity | 1 | |
| Price to Earnings | 2 | |
| Price to Book | 1 |
Historical Rating
Historical scores showcase the consistency in Honeywell's financial performance and market impact.
| Date | Overall | DCF | ROE | ROA | D/E | P/E | P/B |
|---|---|---|---|---|---|---|---|
| 2026-05-12 | 3 | 4 | 5 | 4 | 1 | 2 | 1 |
| Previous | 0 | 4 | 5 | 4 | 1 | 2 | 1 |
Analyst Price Targets
Analyst predictions suggest a promising upside potential within a competitive range for Honeywell's stock.
| High | Low | Median | Consensus |
|---|---|---|---|
| 273 | 195 | 241.5 | 243.83 |
Analyst Sentiment
The analyst sentiment about Honeywell indicates a predominantly positive outlook supported by strong buy signals.
| Recommendation | Count | Distribution |
|---|---|---|
| Strong Buy | 0 | |
| Buy | 17 | |
| Hold | 10 | |
| Sell | 1 | |
| Strong Sell | 0 |
Conclusion
Honeywell presents a balanced investment prospect with stable financial metrics and positive analyst sentiments. While the current fundamentals reflect solid performance, attention should be given to debt ratios. The company's versatile innovation across sectors mitigates risks, providing sustainability. Analyst price targets suggest a compelling upside, reinforcing its long-term growth potential. Overall, Honeywell is positioned well for future prospects in a challenging market environment.
Smart Data Insight
Master the Perfect Entry & Exit for this Stock
Don't leave your profits to chance. Historically, this stock follows specific seasonal patterns that institutional traders use to maximize returns.
- ✅ Identify the "Golden Buying Window"
- ✅ Avoid high-risk correction cycles
- ✅ Backtested data from the last 20+ years