August 27, 2025 a 06:00 pm
HON: Fundamental Ratio Analysis - Honeywell International Inc.
Honeywell International Inc. operates in a diverse range of sectors, offering robust technology and manufacturing solutions. Its recent performance indicates steady returns, with a potential growth outlook bolstered by innovative product lines.
Fundamental Rating
Honeywell's fundamental metrics exhibit a balanced profile, with room for improvement in certain financial metrics.
| Category | Score | Visual |
|---|---|---|
| Discounted Cash Flow | 3 | |
| Return on Equity | 5 | |
| Return on Assets | 4 | |
| Debt to Equity | 1 | |
| Price to Earnings | 2 | |
| Price to Book | 1 |
Historical Rating
The historical data suggests stability in Honeywell's performance, with consistency in core financial metrics.
| Date | Overall | DCF | ROE | ROA | Debt/Equity | P/E | P/B |
|---|---|---|---|---|---|---|---|
| 2025-08-26 | 3 | 3 | 5 | 4 | 1 | 2 | 1 |
| Previous | 0 | 3 | 5 | 4 | 1 | 2 | 1 |
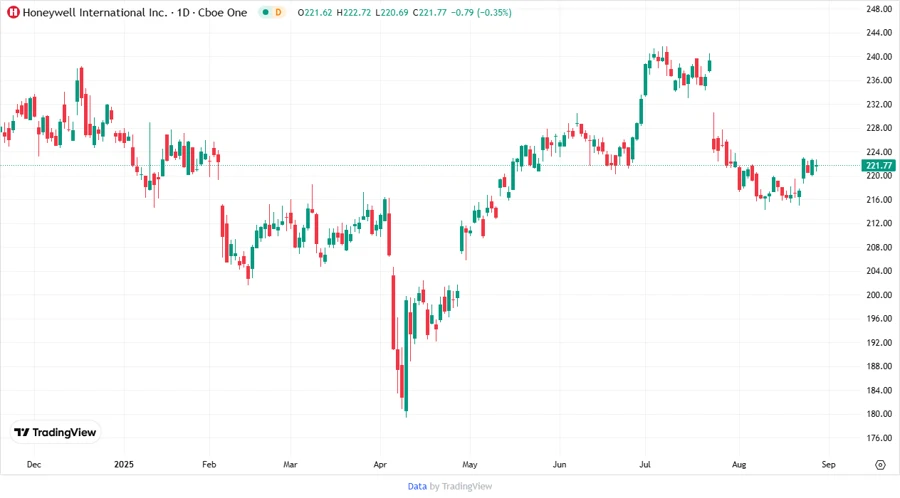
Analyst Price Targets
Analysts maintain a consistent stance on Honeywell, reflecting stable confidence in its market position.
| High | Low | Median | Consensus |
|---|---|---|---|
| $247 | $247 | $247 | $247 |
Analyst Sentiment
The market sentiment is largely positive, with a majority of analysts recommending a strong position on Honeywell.
| Recommendation | Count | Visual |
|---|---|---|
| Strong Buy | 0 | |
| Buy | 15 | |
| Hold | 12 | |
| Sell | 0 | |
| Strong Sell | 0 |
Conclusion
Honeywell International Inc. presents a stable investment opportunity, driven by its solid fundamentals and diverse sector presence. With consistent analyst ratings and price targets, it holds potential for reliable returns. However, close attention to its financial ratios and market dynamics is essential to maximize growth prospects. The industry remains competitive, challenging Honeywell to innovate and adapt continually.
Smart Data Insight
Master the Perfect Entry & Exit for this Stock
Don't leave your profits to chance. Historically, this stock follows specific seasonal patterns that institutional traders use to maximize returns.
- ✅ Identify the "Golden Buying Window"
- ✅ Avoid high-risk correction cycles
- ✅ Backtested data from the last 20+ years