December 15, 2025 a 06:44 am
HON: Fibonacci Analysis - Honeywell International Inc.
Honeywell International Inc. has shown resilience in its diversified technology and manufacturing operations. The stock has experienced a downward trend over the past few months, indicating potential opportunities for rebound as it tests strategic support levels. Investors should closely monitor key technical indicators for a possible reversal in momentum, especially as it approaches significant retracement zones.
Fibonacci Analysis
| Details | Information |
|---|---|
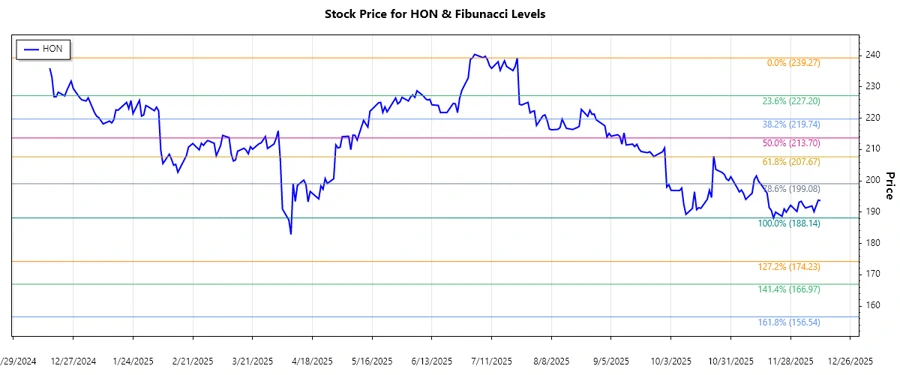
| Trend Start Date | 2024-12-16 |
| Trend End Date | 2025-12-12 |
| High Point | $239.27 on 2025-07-23 |
| Low Point | $188.14 on 2025-11-20 |
| Current Price | $193.66 |
Fibonacci Retracement Levels
| Retracement Level | Price |
|---|---|
| 23.6% (0.236) | $200.53 |
| 38.2% (0.382) | $207.34 |
| 50.0% (0.5) | $213.71 |
| 61.8% (0.618) | $220.08 |
| 78.6% (0.786) | $228.27 |
Current price is not in a significant retracement zone, suggesting that the stock might find preliminary support at the 23.6% retracement level.
The retracement levels indicate potential areas of support and resistance that investors should monitor. If the stock maintains above the 23.6% level, it could indicate a temporary stabilization.
Conclusion
Honeywell International Inc.'s stock has been on a downward trajectory, affecting investor sentiment. However, with its strong market positioning across various technological and manufacturing domains, any successful tests of technical support levels might rekindle bullish interests. Given the current price's proximity to the first retracement level, investors should be vigilant for potential stabilization or a shift in momentum. The stock presents opportunities for value-seeking investors if broader market conditions align with positive catalysts. However, potential risks include global economic uncertainties and sector-specific challenges.