July 05, 2025 a 05:15 am

HON: Fibonacci Analysis - Honeywell International Inc.
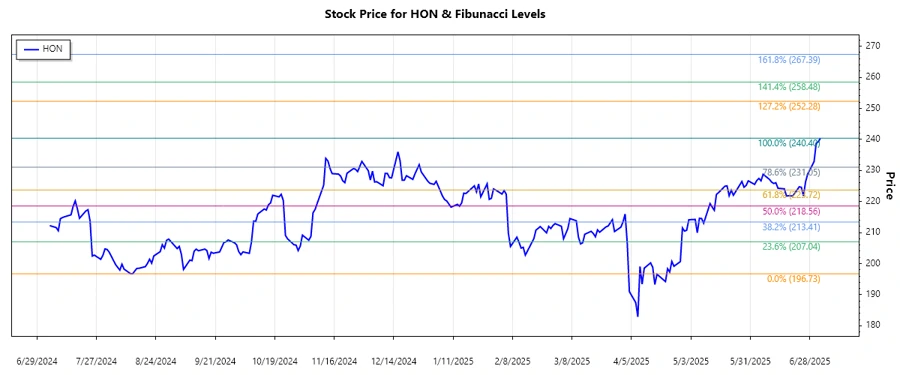
Honeywell International Inc. has shown significant resilience in the market. Recent trends indicate a strong upward momentum, suggesting investor confidence in its diverse technology and manufacturing capabilities. As a major player in aerospace, building technologies, and performance materials, Honeywell is well-positioned to leverage new market opportunities. However, like any large corporation, it is not immune to global economic fluctuations and competitive pressures. The recent upward trend provides a notable bullish signal, yet investors should be mindful of potential retracement levels.
Fibonacci Analysis
| Parameter | Value |
|---|---|
| Trend Start Date | 2024-08-07 |
| Trend End Date | 2025-07-03 |
| High Price | $240.40 on 2025-07-03 |
| Low Price | $196.73 on 2024-08-13 |
| Fibonacci Levels |
|
| Current Price | $240.40 |
| Retracement Zone | None |
| Technical Interpretation | The current price is above all Fibonacci retracement levels, indicating potential continued bullishness. However, a move towards any of the retracement levels could signal a potential support or resistance area. |
Conclusion
Honeywell International Inc. has demonstrated a strong upward trend over the analyzed period, which appears to be continuing beyond the highest Fibonacci retracement levels. This signifies a robust market position and investor optimism. Nonetheless, analysts should monitor potential reversals that could bring the price down to major retracement levels, presenting both challenges and opportunities for long-term and short-term investors. Strategic vigilance will be crucial in leveraging these technical insights for maximized investment returns.
Smart Data Insight
Master the Perfect Entry & Exit for this Stock
Don't leave your profits to chance. Historically, this stock follows specific seasonal patterns that institutional traders use to maximize returns.
- ✅ Identify the "Golden Buying Window"
- ✅ Avoid high-risk correction cycles
- ✅ Backtested data from the last 20+ years