March 14, 2026 a 07:46 am
HON: Dividend Analysis - Honeywell International Inc.
Honeywell International Inc. showcases a remarkable dividend history with a strong yield and solid dividend growth, ensuring continued investor confidence. As a dominant player in the industrial sector, Honeywell maintains a resilient dividend profile despite challenging market dynamics. This analysis breaks down the company's dividend health, growth potential, and financial stability to provide a clear understanding of its investment appeal.
📊 Overview
Honeywell International Inc. operates in the Industrial sector. With a consistent dividend yield of 1.85%, an impressive 57 years of dividend history, and no recent cuts or suspensions, the company demonstrates exceptional reliability to its shareholders.
| Attribute | Details |
|---|---|
| Sector | Industrial |
| Dividend Yield | 1.85% |
| Current Dividend per Share | 4.66 USD |
| Dividend History | 57 years |
| Last Cut or Suspension | None |
🗣️ Dividend History
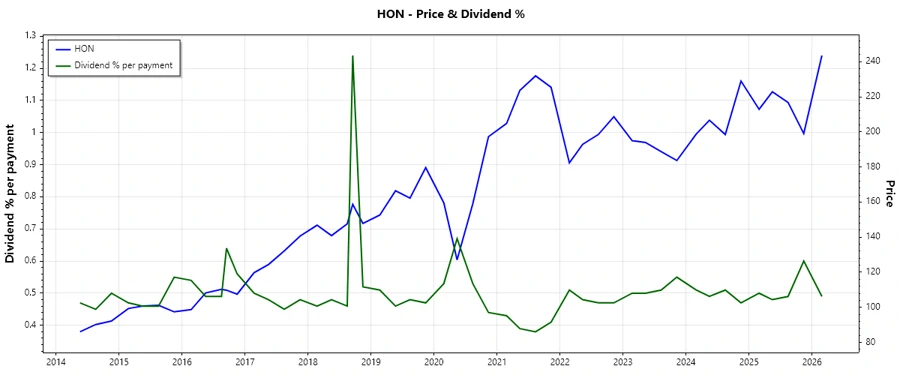
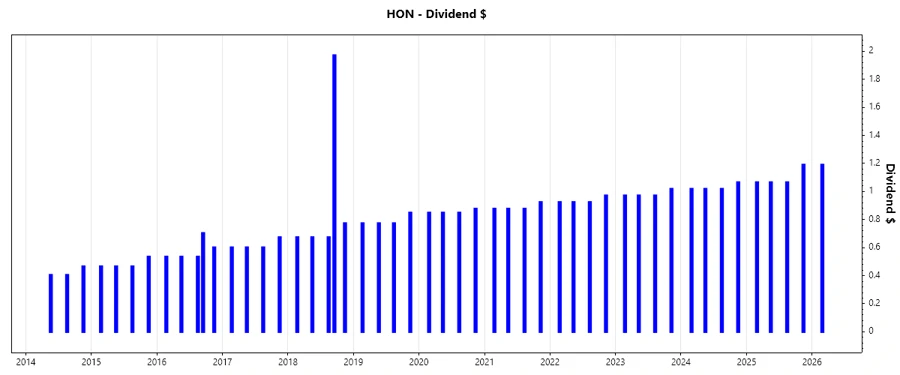
The company’s long-standing practice of consistent dividend payments over 57 years speaks volumes about its commitment to returning value to shareholders and financial stability. The below chart and table give a detailed view into the recent dividend performance that has been key to investor satisfaction.
| Year | Dividend per Share (USD) |
|---|---|
| 2026 | 1.19 |
| 2025 | 4.39 |
| 2024 | 4.12 |
| 2023 | 3.93 |
| 2022 | 3.74 |
📈 Dividend Growth
Studying the growth trend in dividends is critical for understanding the future yield potential. Honeywell's dividend growth over the past 3 to 5 years indicates robust corporate performance and continuous strategic enhancements that foster shareholder returns.
| Time | Growth |
|---|---|
| 3 years | 5.43% |
| 5 years | 5.09% |
The average dividend growth is 5.09% over 5 years. This shows moderate but steady dividend growth.
📉 Payout Ratio
Evaluating the payout ratios is crucial as they reveal how sustainable the company's dividend payments are in relation to its earnings and cash flow. A lower payout ratio typically indicates dividend stability and room for growth.
| Key Figure | Ratio |
|---|---|
| EPS-based | 57.57% |
| Free cash flow-based | 54.90% |
With an EPS payout ratio of 57.57% and a free cash flow payout of 54.90%, Honeywell exhibits a balanced approach in managing its earnings and cash outflows, enabling sustainable dividend distributions.
✅ Cashflow & Capital Efficiency
Analyzing cash flow and capital efficiency helps us assess the company’s capability to fund dividends from its core operations, and how efficiently it uses its resources to generate returns.
| Metrics | 2023 | 2024 | 2025 |
|---|---|---|---|
| Free Cash Flow Yield | 3.10% | 3.36% | 4.33% |
| Earnings Yield | 4.07% | 3.88% | 4.12% |
| CAPEX to Operating Cash Flow | 19.46% | 19.09% | 15.46% |
| Stock-based Compensation to Revenue | 0.55% | 0.50% | 0% |
| Free Cash Flow / Operating Cash Flow Ratio | 80.54% | 80.91% | 84.54% |
The solid free cash flow to operating cash flow ratios highlight Honeywell's robust operational cash generation, underpinning both its financial strength and its capacity to sustain dividends.
⚠️ Balance Sheet & Leverage Analysis
Understanding the balance sheet strength and leverage ratios is essential to evaluate Honeywell's long-term financial health and its ability to meet current and future obligations.
| Metric | 2023 | 2024 | 2025 |
|---|---|---|---|
| Debt-to-Equity | 1.36 | 1.73 | 2.24 |
| Debt-to-Assets | 35.00% | 42.85% | 46.66% |
| Debt-to-Capital | 57.60% | 63.38% | 69.13% |
| Net Debt to EBITDA | 1.50 | 2.25 | 2.55 |
| Current Ratio | 1.27 | 1.31 | 1.32 |
| Quick Ratio | 0.93 | 1.01 | 1.05 |
| Financial Leverage | 3.88 | 4.04 | 4.80 |
The upward trend in leverage ratios suggests a growing reliance on debt which, while potentially risky, is currently well-managed through healthy coverage ratios.
✅ Fundamental Strength & Profitability
The profitability and efficiency ratios present a comprehensive picture of how Honeywell uses its resources to generate profit and produce returns on equity and assets.
| Metric | 2023 | 2024 | 2025 |
|---|---|---|---|
| Return on Equity | 35.68% | 30.64% | 33.28% |
| Return on Assets | 9.20% | 7.59% | 6.93% |
| Return on Invested Capital | 13.25% | 10.48% | 9.33% |
| Net Margin | 15.44% | 14.82% | 13.73% |
| EBIT Margin | 21.62% | 21.49% | 19.47% |
| EBITDA Margin | 24.83% | 24.95% | 23.18% |
| Gross Margin | 39.00% | 38.33% | 36.93% |
The consistent strength in profitability ratios underscores Honeywell's robust operational efficiency and its strategic focus on enhancing shareholder value.
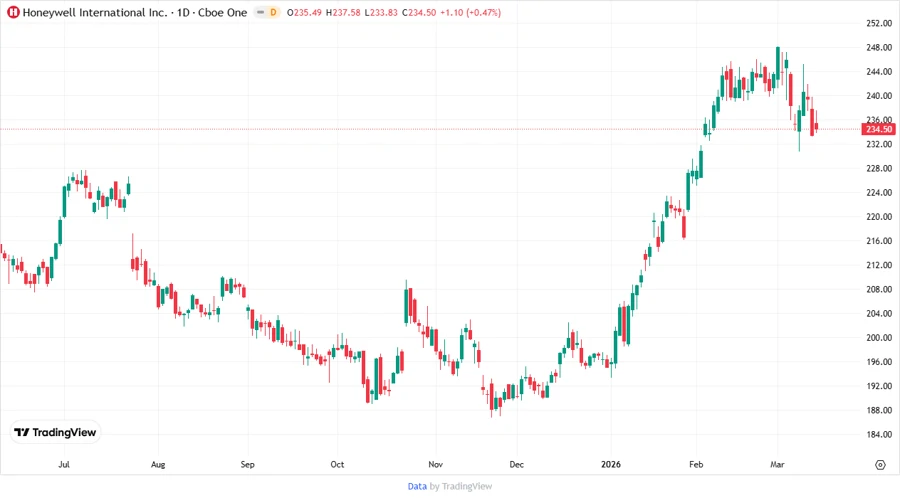
📈 Price Development
📊 Dividend Scoring System
| Criteria | Rating | Score |
|---|---|---|
| Dividend Yield | 3 | |
| Dividend Stability | 5 | |
| Dividend Growth | 4 | |
| Payout Ratio | 4 | |
| Financial Stability | 4 | |
| Dividend Continuity | 5 | |
| Cashflow Coverage | 4 | |
| Balance Sheet Quality | 3 |
Overall Score: 32/40
📈 Rating
Honeywell International Inc. maintains a solid dividend strategy with consistent growth and stability. The company's strong financial performance and cash flow management positions it as an attractive investment opportunity for dividend-seeking investors. With an overall score of 32 out of 40, Honeywell is recommended for its reliable dividend policy and potential for future growth.
Smart Data Insight
Master the Perfect Entry & Exit for this Stock
Don't leave your profits to chance. Historically, this stock follows specific seasonal patterns that institutional traders use to maximize returns.
- ✅ Identify the "Golden Buying Window"
- ✅ Avoid high-risk correction cycles
- ✅ Backtested data from the last 20+ years