January 03, 2026 a 07:46 am
HON: Dividend Analysis - Honeywell International Inc.
Honeywell International Inc. (HON) represents a strong pillar in the dividend investment domain, presenting a robust yield and a long history of uninterrupted dividend distribution. The company's consistent dividend growth and secure financial metrics mark it as a reliable option for income-seeking investors.
📊 Overview
Sector: Industrials
| Metric | Value |
|---|---|
| Dividend yield | 2.2 % |
| Current dividend per share | 4.46 USD |
| Dividend history | 56 years |
| Last cut or suspension | 2019 |
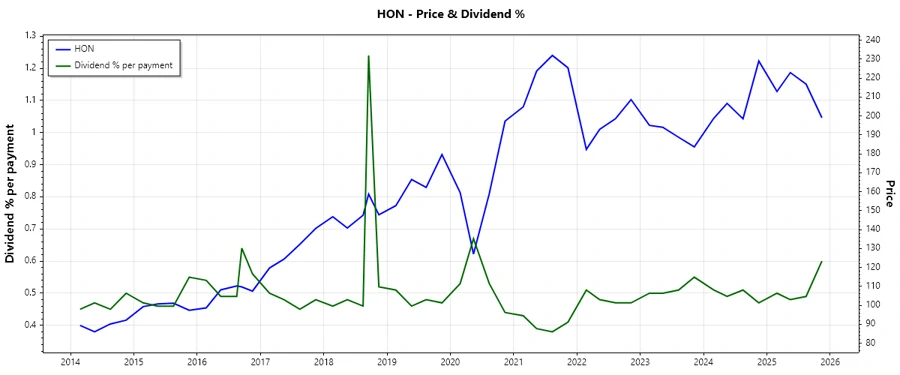
🗣️ Dividend History
Honeywell's commitment to returning value to shareholders is evident in its lengthy dividend paying streak. The company's ability to sustain dividends over various market cycles underscores its operational efficiency and market resilience.
This image shows the dividend trend over the years, reflecting stability and reliability.
| Year | Dividend per share (USD) |
|---|---|
| 2025 | 4.39 |
| 2024 | 4.12 |
| 2023 | 3.93 |
| 2022 | 3.74 |
| 2021 | 3.55 |
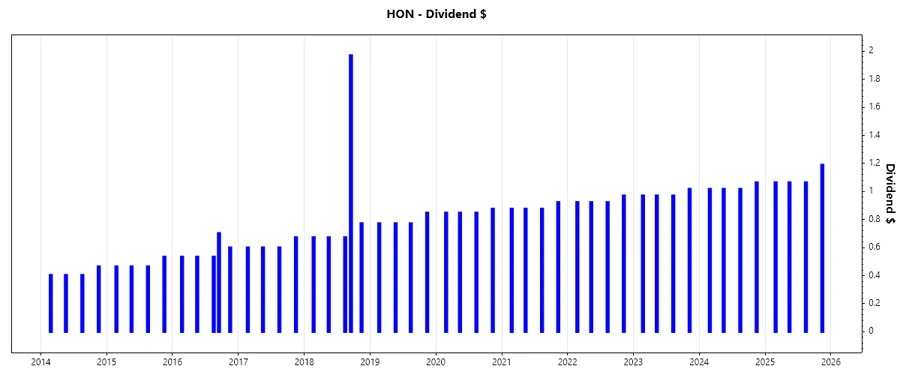
📈 Dividend Growth
Dividend growth is a critical measure of corporate health and shareholder value enhancement. Honeywell has demonstrated its ability to increase dividends consistently, reflecting prudent capital allocation and future growth confidence.
| Time | Growth |
|---|---|
| 3 years | 5.43 % |
| 5 years | 5.09 % |
The average dividend growth is 5.09% over 5 years. This shows moderate but steady dividend growth, enhancing investor confidence in continual returns.
This image illustrates the upward trajectory of dividend growth.
✅ Payout Ratio
A key indicator of dividend sustainability, the payout ratio helps investors assess the safety of dividend payments. Healthy ratios suggest that a company is not overly burdened by its dividend obligations.
| Key figure | Ratio |
|---|---|
| EPS-based | 46.21 % |
| Free cash flow-based | 45.92 % |
The EPS-based payout ratio of 46.21% and the FCF-based ratio of 45.92% signify a well-balanced approach to dividend payments without straining the company's financial resources.
💼 Cashflow & Capital Efficiency
Assessing cash flow and capital efficiency metrics is essential for understanding the operational effectiveness and investment quality of the company. Honeywell appears to allocate capital efficiently, underscored by its favorable cash flow attributes.
| Year | 2024 | 2023 | 2022 |
|---|---|---|---|
| Free Cash Flow Yield | 3.36 % | 3.09 % | 3.11 % |
| CAPEX to Operating Cash Flow | 19.09 % | 19.46 % | 14.52 % |
| Stock-based Compensation to Revenue | 0.50 % | 0.55 % | 0.53 % |
| Free Cash Flow / Operating Cash Flow Ratio | 80.91 % | 80.54 % | 85.48 % |
The company's solid cash flow yields and low capex levels confirm its capacity to sustain dividends and reinvest in growth initiatives efficiently.
📏 Balance Sheet & Leverage Analysis
Analyzing financial leverage provides insight into a company's risk profile. Honeywell's healthy debt levels indicate manageable financial obligations, enhancing its creditworthiness and ability to finance operations and growth without excessive leverage.
| Year | 2024 | 2023 | 2022 |
|---|---|---|---|
| Debt-to-Equity | 1.73 | 1.36 | 1.23 |
| Net Debt to EBITDA | 2.25 | 1.50 | 1.36 |
| Current Ratio | 1.31 | 1.27 | 1.25 |
| Quick Ratio | 1.01 | 0.93 | 0.98 |
Honeywell maintains a balanced leverage profile, evidencing financial flexibility for future growth and crisis management.
💡 Fundamental Strength & Profitability
High profitability ratios are imperative for a company’s ability to generate returns for its investors. Honeywell demonstrates strong return ratios across its operations.
| Year | 2024 | 2023 | 2022 |
|---|---|---|---|
| Return on Equity | 30.64 % | 35.68 % | 29.74 % |
| Return on Assets | 7.59 % | 9.20 % | 7.97 % |
| Research & Development to Revenue | 3.99 % | 3.97 % | 4.17 % |
Honeywell’s maintenance of robust profitability measures, such as ROE and ROA, implies efficient use of capital to drive earnings and innovation.
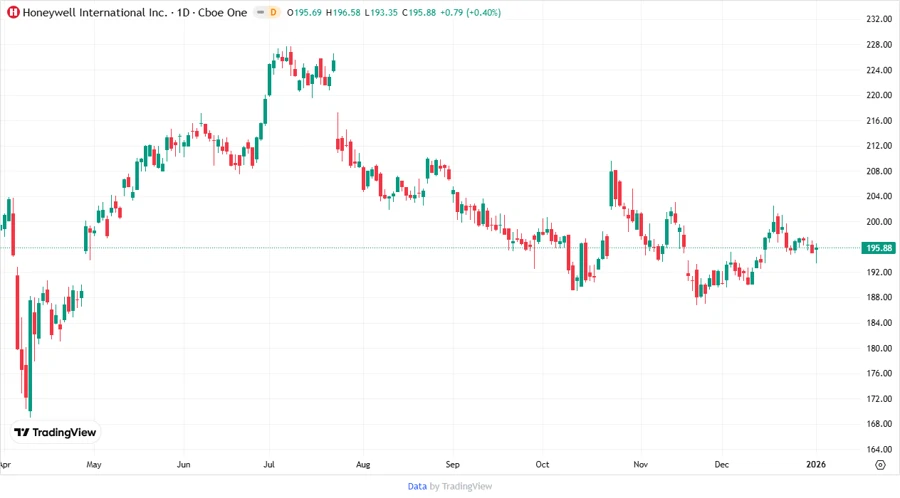
📉 Price Development
This chart gives a visual summary of Honeywell's stock price movement, helping investors gauge market performance and valuation trends.
🔍 Dividend Scoring System
| Category | Score | Visual Indicator |
|---|---|---|
| Dividend yield | 4 | |
| Dividend Stability | 5 | |
| Dividend Growth | 3 | |
| Payout ratio | 4 | |
| Financial stability | 4 | |
| Dividend continuity | 5 | |
| Cashflow Coverage | 3 | |
| Balance Sheet Quality | 4 |
Total Score: 32/40
📊 Rating
In conclusion, Honeywell International Inc. emerges as a reputable and dependable dividend payer, showing robust metrics across various financial dimensions. Its solid dividend track record, paired with consistent growth patterns, makes it a compelling choice for dividend-focused portfolios. Overall, we recommend considering Honeywell as a stable addition, particularly for long-term income generation and capital appreciation strategies.