December 19, 2025 a 11:31 am
HON: Dividend Analysis - Honeywell International Inc.
Honeywell International Inc. presents a formidable profile within the dividend universe, showcasing a consistent commitment to shareholder returns. With a steady dividend yield and an impressive history of uninterrupted payments over the decades, Honeywell remains a reliable choice for income-seeking investors. However, investors should be mindful of market conditions that could impact future payouts and growth rates.
📊 Overview
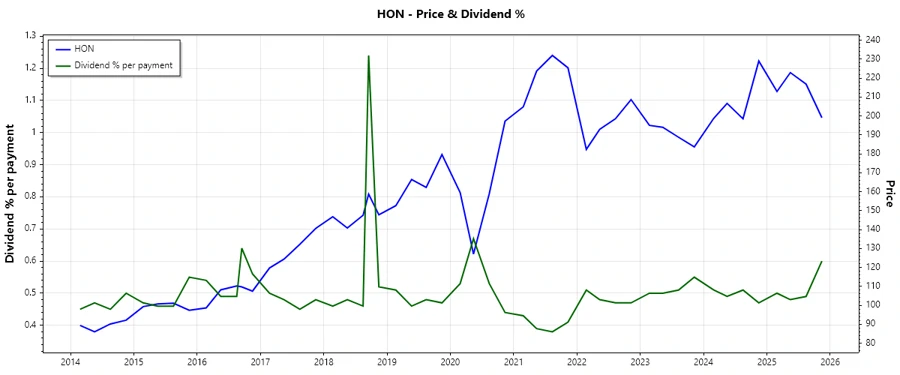
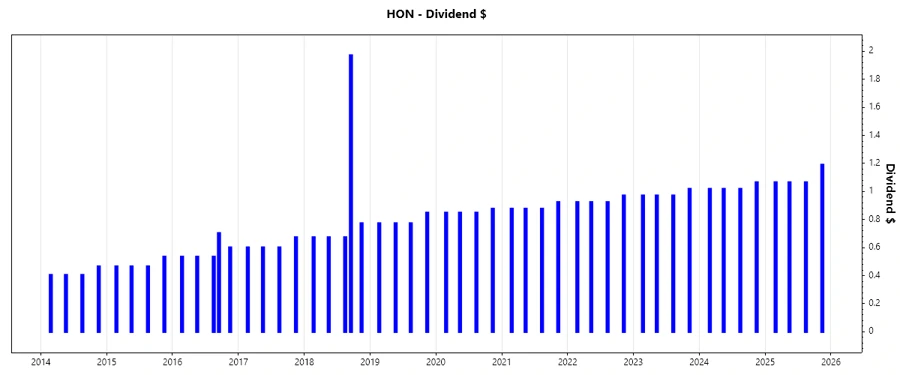
Honeywell operates in a diversified industrial sector, ideally positioning itself to offer stable dividends. The dividend yield is currently 2.20%, with the latest dividend per share being 4.46 USD. With over 56 years of consecutive dividend history and the last cut occurring in 2019, the consistency reaffirmed Honeywell's robust dividend policy.
| Key Metric | Value |
|---|---|
| Sector | Diversified Industrials |
| Dividend yield | 2.20% |
| Current dividend per share | 4.46 USD |
| Dividend history | 56 years |
| Last cut or suspension | 2019 |
🗣️ Dividend History
Evaluating Honeywell's dividend history reveals its commitment to providing shareholder value. An impressive track of consecutive dividend payments highlights the company's resilient business model and management's alignment with shareholders' interests.
| Year | Dividend per share (USD) |
|---|---|
| 2025 | 4.39 |
| 2024 | 4.12 |
| 2023 | 3.93 |
| 2022 | 3.74 |
| 2021 | 3.55 |
📈 Dividend Growth
Understanding Honeywell's dividend growth is vital when assessing its potential as a long-term income investment. Over the last three and five years, dividend growth has shown moderate increases, indicating stable company earnings and cash flows.
| Time | Growth |
|---|---|
| 3 years | 5.05% |
| 5 years | 5.40% |
The average dividend growth is 5.40% over 5 years. This shows moderate but steady dividend growth.
✅ Payout Ratio
The payout ratio is a critical determinant of dividend sustainability. Honeywell's EPS-based payout ratio stands at 46.21%, while its free cash flow-based payout ratio is 45.92%. These figures indicate a healthy payout that balances rewarding shareholders and maintaining growth potential.
| Key figure ratio | Percentage |
|---|---|
| EPS-based | 46.21% |
| Free cash flow-based | 45.92% |
These prudent payout ratios suggest that Honeywell has ample room to sustain its dividend payments while reinvesting in its growth strategies.
📉 Cashflow & Capital Efficiency
Analyzing cash flow and capital efficiency is imperative for evaluating Honeywell's capability to maintain and grow dividend payments. The free cash flow generation remains robust, which is critical to support the dividend payments and capital expenditures.
| Year | 2024 | 2023 | 2022 |
|---|---|---|---|
| Free Cash Flow Yield | 3.36% | 3.09% | 3.11% |
| Earnings Yield | 3.88% | 4.07% | 3.42% |
| CAPEX to Operating Cash Flow | 19.09% | 19.46% | 14.52% |
| Stock-based Compensation to Revenue | 0.50% | 0.55% | 0.53% |
| Free Cash Flow / Operating Cash Flow Ratio | 80.91% | 80.54% | 85.48% |
The cash flow metrics denote Honeywell's potential to maintain a strategic balance between shareholder payouts and reinvestments, supported by effective capital management strategies.
Balance Sheet & Leverage Analysis
Honeywell's balance sheet and leverage analysis suggest a well-managed debt structure supporting operational stability. A favorable debt-to-equity ratio and manageable leverage signify sound financial health.
| Year | 2024 | 2023 | 2022 |
|---|---|---|---|
| Debt-to-Equity | 1.73 | 1.36 | 1.23 |
| Debt-to-Assets | 42.85% | 35.00% | 32.98% |
| Debt-to-Capital | 63.38% | 57.60% | 55.16% |
| Net Debt to EBITDA | 2.33 | 1.50 | 1.36 |
| Current Ratio | 1.31 | 1.27 | 1.25 |
| Quick Ratio | 1.01 | 0.93 | 0.98 |
| Financial Leverage | 4.04 | 3.88 | 3.73 |
These solid leverage metrics underscore Honeywell's ability to mitigate financial risks and manage its capital flexibly.
Fundamental Strength & Profitability
Honeywell's fundamental strengths lie in its profitability metrics, which reflect its capability to generate significant returns and maintain competitive profit margins.
| Year | 2024 | 2023 | 2022 |
|---|---|---|---|
| Return on Equity | 30.64% | 35.68% | 29.74% |
| Return on Assets | 7.59% | 9.20% | 7.97% |
| Return on Invested Capital | 10.48% | 13.25% | 11.99% |
| Margins: Net | 14.82% | 15.44% | 14.01% |
| EBIT | 21.49% | 21.62% | 19.16% |
| EBITDA | 24.95% | 24.83% | 22.56% |
| Gross | 38.34% | 39.00% | 38.40% |
| R&D to Revenue | 4.53% | 3.97% | 4.17% |
Overall, the company's strong profitability metrics and efficient cost management enable it to sustain its competitive positioning.
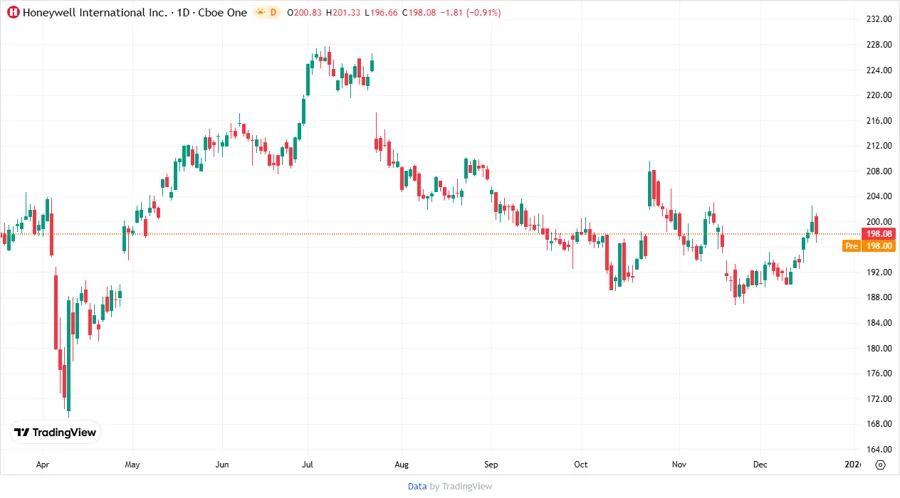
📈 Price Development
🏆 Dividend Scoring System
| Category | Score | Bar |
|---|---|---|
| Dividend yield | 4 | |
| Dividend Stability | 5 | |
| Dividend growth | 3 | |
| Payout ratio | 4 | |
| Financial stability | 4 | |
| Dividend continuity | 5 | |
| Cashflow Coverage | 4 | |
| Balance Sheet Quality | 4 |
Overall Score: 33/40
🔍 Rating
Based on the comprehensive dividend analysis, Honeywell International Inc. stands out as a strong contender for investors focused on dividend income. With consistent dividend payments, balanced payout ratios, and solid fundamentals, Honeywell offers a stable investment opportunity, though continuous monitoring of its financial strategy remains essential.