November 07, 2025 a 02:48 am
HON: Dividend Analysis - Honeywell International Inc.
Honeywell International Inc. has maintained a solid reputation for dividend reliability and moderate growth. With a significant track record extending over decades, the company's dividend profile remains attractive for long-term, income-focused investors. Yet, a strategic approach is essential given recent economic conditions that could pose challenges to dividend stability in the near future.
Overview 📊
| Category | Value |
|---|---|
| Sector | Conglomerate |
| Dividend yield | 2.24% |
| Current dividend per share | 4.46 USD |
| Dividend history | 56 years |
| Last cut or suspension | 2019 |
Dividend History 🗣️
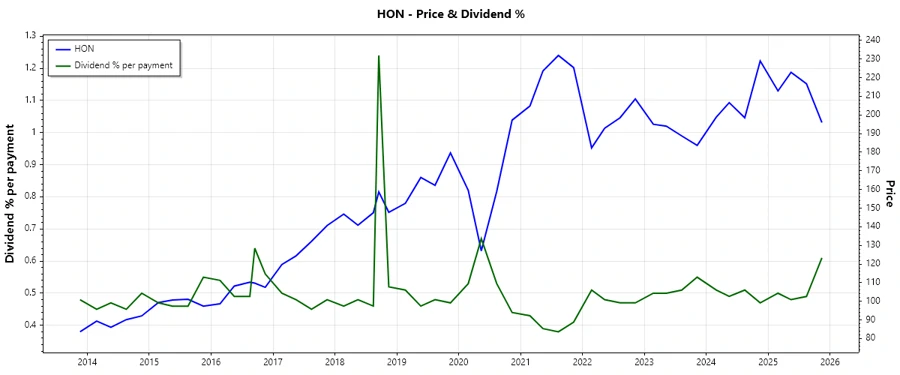
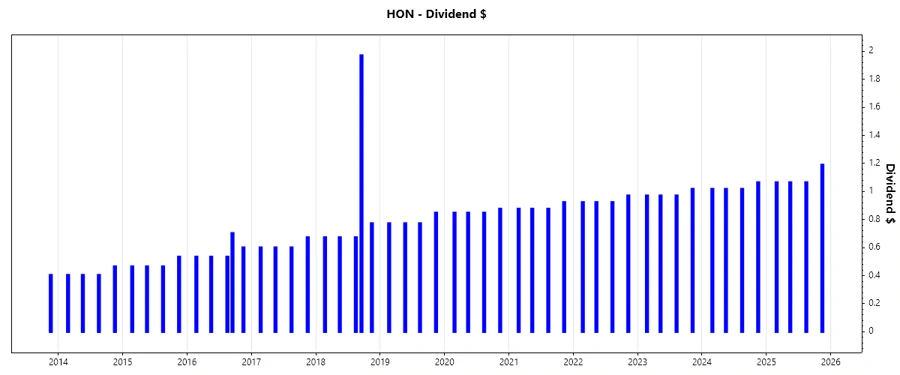
Over the past 56 years, Honeywell has demonstrated consistent dividend payments, marking it a reliable choice for dividend income. The longevity of its dividend payments reflects the company's strong financial health and commitment to shareholders.
| Year | Dividend Per Share (USD) |
|---|---|
| 2025 | 4.39 |
| 2024 | 4.12 |
| 2023 | 3.93 |
| 2022 | 3.74 |
| 2021 | 3.55 |
Dividend Growth 📈
The dividend growth rates of Honeywell stand at 5.05% over 3 years and 5.40% over 5 years. These figures indicate moderate but steady increases in shareholder returns, reinforcing confidence in the company's capacity to grow its dividend payouts.
| Time | Growth |
|---|---|
| 3 years | 5.05 % |
| 5 years | 5.40 % |
The average dividend growth is 5.40% over 5 years. This shows moderate but steady dividend growth.
Payout Ratio ⚠️
The payout ratio is a pivotal tool in assessing the sustainability of a company's dividends. Honeywell's payout ratios reflect a disciplined approach, with EPS-based and FCF-based payouts at 46.21% and 45.92% respectively, indicating ample room for reinvestment and potential dividend expansions.
| Key figure | Ratio |
|---|---|
| EPS-based | 46.21% |
| Free cash flow-based | 45.92% |
These payout ratios confirm that Honeywell is allocating a reasonable portion of earnings and cash flow to dividends, ensuring sustainable distributions.
Cashflow & Capital Efficiency ✅
Cash flow and capital efficiency metrics are crucial in evaluating Honeywell's capacity to sustain its dividend payouts and fund future growth. Key figures such as Free Cash Flow Yield and Earnings Yield offer insights into the firm's efficiency in converting revenue to cash.
| Metric | 2024 | 2023 | 2022 |
|---|---|---|---|
| Free Cash Flow Yield | 3.35% | 3.09% | 3.11% |
| Earnings Yield | 3.88% | 4.07% | 3.42% |
| CAPEX to Operating Cash Flow | 19.09% | 19.46% | 14.52% |
| Stock-based Compensation to Revenue | 0.50% | 0.55% | 0.53% |
| Free Cash Flow / Operating Cash Flow Ratio | 80.91% | 80.54% | 85.48% |
The compounding efficiency in cash flow and use of capital suggests a robust business model capable of weathering economic fluctuations and supporting future dividends.
Balance Sheet & Leverage Analysis 📉
Analyzing the balance sheet allows us to assess how Honeywell manages its debts and maintains liquidity - a critical consideration for sustaining dividend payouts during financial strain.
| Metric | 2024 | 2023 | 2022 |
|---|---|---|---|
| Debt-to-Equity | 1.73 | 1.36 | 1.23 |
| Debt-to-Assets | 0.43 | 0.35 | 0.33 |
| Debt-to-Capital | 0.63 | 0.58 | 0.55 |
| Net Debt to EBITDA | 2.33 | 1.50 | 1.36 |
| Current Ratio | 1.31 | 1.27 | 1.25 |
| Quick Ratio | 1.01 | 0.93 | 0.98 |
| Financial Leverage | 4.04 | 3.88 | 3.73 |
The balance sheet reveals adequate leverage management with improving liquidity ratios, positioning the company well against financial volatilities.
Fundamental Strength & Profitability 📊
The fundamental strengths are underscored by profitability metrics reflecting efficient management and solid returns, accentuating Honeywell's position as a stable, profit-generating entity.
| Metric | 2024 | 2023 | 2022 |
|---|---|---|---|
| Return on Equity | 30.64% | 35.68% | 29.74% |
| Return on Assets | 7.59% | 9.20% | 7.97% |
| Margins: Net | 14.82% | 15.44% | 14.01% |
| EBIT | 21.49% | 21.62% | 19.16% |
| EBITDA | 24.95% | 24.83% | 22.56% |
| Gross | 38.34% | 39.00% | 38.40% |
| R&D to Revenue | 4.53% | 3.97% | 4.17% |
The data reflects a consistent performance in profitability across years, backed by effectively managed operations and strategic investments in R&D.
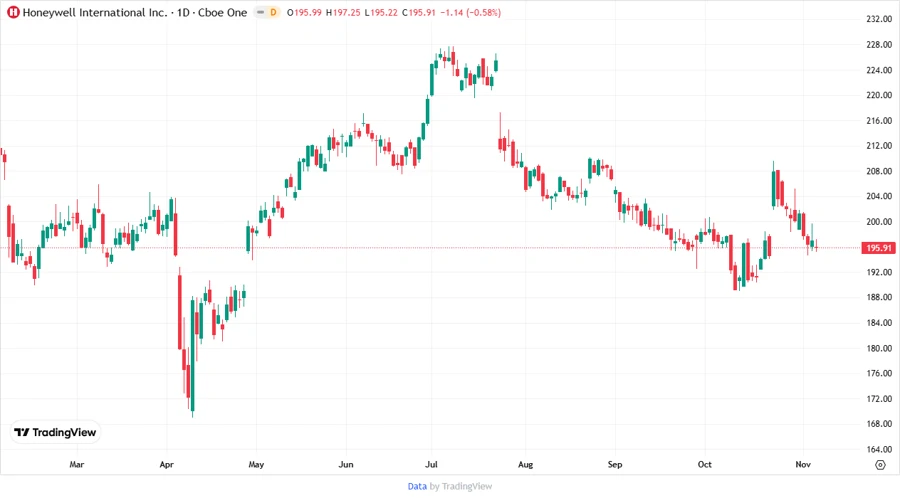
Price Development 📈
Dividend Scoring System 📋
| Criteria | Score | Score Bar |
|---|---|---|
| Dividend yield | 3 | |
| Dividend Stability | 5 | |
| Dividend growth | 4 | |
| Payout ratio | 4 | |
| Financial stability | 4 | |
| Dividend continuity | 5 | |
| Cashflow Coverage | 4 | |
| Balance Sheet Quality | 4 |
Overall Score: 33/40
Rating 🏆
Honeywell International Inc. receives a favorable rating, attributable to its robust dividend history, consistent growth in payouts, and strong financial health. For investors seeking stable dividend income with growth potential, Honeywell represents a viable opportunity. Continued monitoring of economic conditions, however, should remain a priority for assessing future outlooks.
Smart Data Insight
Master the Perfect Entry & Exit for this Stock
Don't leave your profits to chance. Historically, this stock follows specific seasonal patterns that institutional traders use to maximize returns.
- ✅ Identify the "Golden Buying Window"
- ✅ Avoid high-risk correction cycles
- ✅ Backtested data from the last 20+ years