August 23, 2025 a 12:47 pm


HON: Dividend Analysis - Honeywell International Inc.
Honeywell International Inc. has demonstrated a strong dividend history with consistent payouts over the past decades. The company's ability to not only maintain but grow its dividend payments signals a resilient business model and commitment to shareholder returns. Investors seeking stable income could find Honeywell's profile attractive, especially given its long-standing reputation for financial stability.
📊 Overview
Honeywell operates in the diversified industrials sector, offering a blend of stability and growth to its investors. The company sports a dividend yield of 2.09%, with a current dividend of 4.46 USD per share. With an impressive 56-year history of dividend payments and no recent cuts or suspensions, Honeywell remains a stalwart in the industrial sector for dividend investors.
| Data | Value |
|---|---|
| Sector | Diversified Industrials |
| Dividend Yield | 2.09% |
| Current Dividend per Share | 4.46 USD |
| Dividend History | 56 years |
| Last Cut or Suspension | None |
📈 Dividend History
Honeywell's long-standing history of dividend payments highlights the company's consistent financial strength and reliability. A sustained history like this is critical in assessing the risk and commitment to returning value to shareholders. Such stability over multiple decades boosts investor confidence and aides in risk management.
| Year | Dividend per Share |
|---|---|
| 2025 | 3.39 USD |
| 2024 | 4.37 USD |
| 2023 | 4.17 USD |
| 2022 | 3.97 USD |
| 2021 | 3.77 USD |
📈 Dividend Growth
Dividend growth is a crucial metric offering insights into the company's future prospective value for shareholders. Honeywell has maintained dividend growth over the last few years making it appealing to dividend growth investors.
| Time | Growth |
|---|---|
| 3 years | 5.05% |
| 5 years | 5.40% |
The average dividend growth is 5.40% over 5 years. This shows moderate but steady dividend growth.
📉 Payout Ratio
The payout ratio reflects the proportion of earnings paid out as dividends. Honeywell's EPS-based payout ratio is 49.72%, while the FCF-based payout ratio is 56.98%. Both figures suggest the company maintains a balance between rewarding shareholders and preserving capital for future growth.
| Key Figure | Ratio |
|---|---|
| EPS-based | 49.72% |
| Free Cash Flow-based | 56.98% |
💸 Cashflow & Capital Efficiency
Examining a firm's cashflow and capital efficiency provides insights into its operational effectiveness and ability to fund dividends sustainably. Metrics like Free Cash Flow Yield and Earnings Yield indicate the company's profitability relative to its price. Honeywell displays solid metrics that underpin its financial resilience.
| Metric | 2024 | 2023 | 2022 |
|---|---|---|---|
| Free Cash Flow Yield | 3.36% | 3.09% | 3.11% |
| Earnings Yield | 3.88% | 4.07% | 3.42% |
| CAPEX to Operating Cash Flow | 19.09% | 19.45% | 14.52% |
| Stock-based Compensation to Revenue | 0.50% | 0.55% | 0.53% |
| Free Cash Flow / Operating Cash Flow Ratio | 80.91% | 80.54% | 85.48% |
🔍 Balance Sheet & Leverage Analysis
A strong balance sheet ensures financial stability and the capability to meet obligations. Honeywell's debt ratios are within acceptable ranges, indicating healthy use of leverage. Financial ratios like Debt-to-Equity and Current Ratio provide a comprehensive view of liquidity and financial stability.
| Metric | 2024 | 2023 | 2022 |
|---|---|---|---|
| Debt-to-Equity | 1.73 | 1.36 | 1.23 |
| Debt-to-Assets | 0.43 | 0.35 | 0.33 |
| Debt-to-Capital | 0.63 | 0.58 | 0.55 |
| Net Debt to EBITDA | 2.25 | 1.50 | 1.36 |
| Current Ratio | 1.31 | 1.27 | 1.25 |
| Quick Ratio | 1.01 | 0.93 | 0.98 |
| Financial Leverage | 4.04 | 3.88 | 3.73 |
📊 Fundamental Strength & Profitability
Evaluating the fundamental strength involves assessing the company's efficiency in generating profit relative to its assets and equity. Honeywell demonstrates robust return metrics, supported by strong margins and efficient capital management, making it an appealing prospect for profitability-focused investors.
| Metric | 2024 | 2023 | 2022 |
|---|---|---|---|
| Return on Equity | 30.64% | 35.68% | 29.74% |
| Return on Assets | 7.59% | 9.20% | 7.97% |
| Margins: Net | 14.82% | 15.43% | 14.01% |
| Margins: EBIT | 21.49% | 21.62% | 19.16% |
| Margins: EBITDA | 24.95% | 24.83% | 22.56% |
| Margins: Gross | 38.34% | 39.00% | 38.40% |
| Research & Development to Revenue | 4.29% | 3.97% | 4.17% |
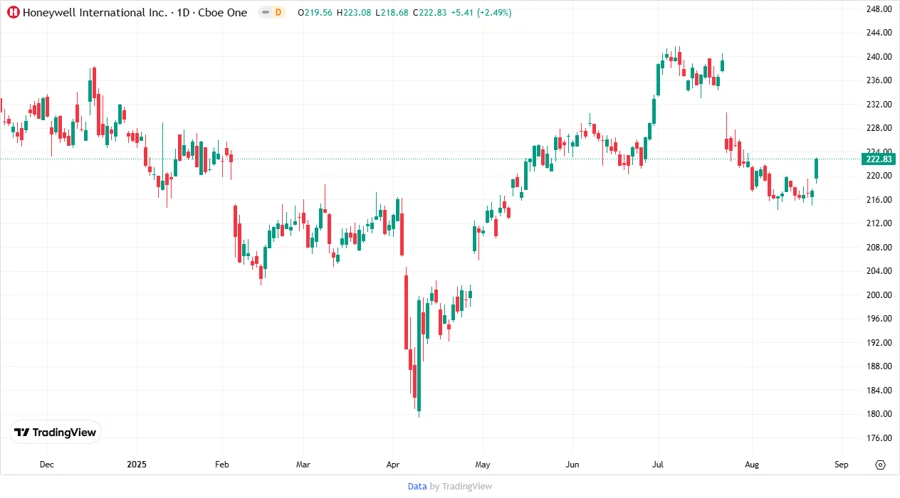
📈 Price Development
🎯 Dividend Scoring System
| Category | Score | Score Bar |
|---|---|---|
| Dividend yield | 3 | |
| Dividend Stability | 4 | |
| Dividend growth | 4 | |
| Payout ratio | 4 | |
| Financial stability | 5 | |
| Dividend continuity | 5 | |
| Cashflow Coverage | 4 | |
| Balance Sheet Quality | 4 |
Overall Score: 33/40
✅ Rating
With a robust dividend history and consistent growth, Honeywell International Inc. positions itself as a reliable choice for income-seeking investors. The firm's financial stability and diversified operations contribute to a favorable dividend investment outlook, making it a "Buy" in the dividend investment landscape.