August 14, 2025 a 09:03 am

HOLX: Trend and Support & Resistance Analysis - Hologic, Inc.
Hologic, Inc. (HOLX) has shown resilience over the analyzed period with a moderate uptick indicating a slowly gaining momentum. Current technical indicators show a transitional phase where opportunities for careful gains exist. Investors should watch for further confirmation signals given the current market backdrop heavily characterized by past fluctuations.
Trend Analysis
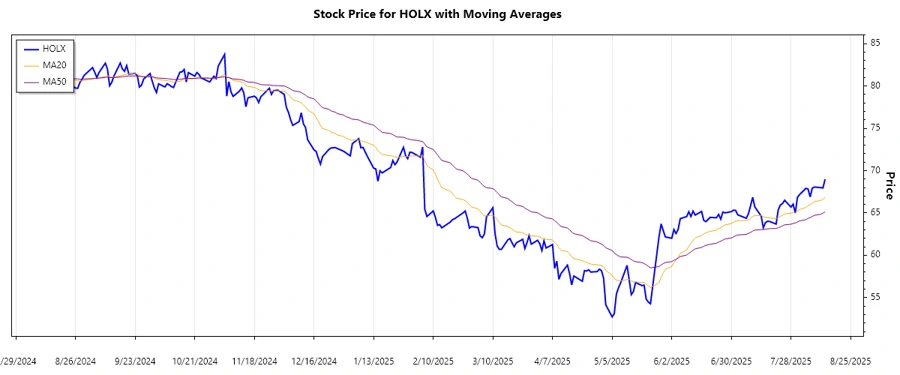
Examining the daily closing prices of HOLX, we've calculated the EMA20 and EMA50 to identify trends. The latest data indicates:
| Date | Close Price | Trend |
|---|---|---|
| 2025-08-13 | 68.98 | ▲ Upward |
| 2025-08-12 | 67.95 | ▲ Upward |
| 2025-08-11 | 67.99 | ▲ Upward |
| 2025-08-08 | 68.06 | ▲ Upward |
| 2025-08-07 | 67.93 | ▲ Upward |
| 2025-08-06 | 66.89 | ▲ Upward |
| 2025-08-05 | 67.82 | ▲ Upward |
The EMA20 currently exceeds the EMA50, suggesting a prevailing upward trend. This is an optimistic signal for short-term traders, pointing to potential gains. However, monitoring for sustained price action above these indicators is crucial.
Support and Resistance
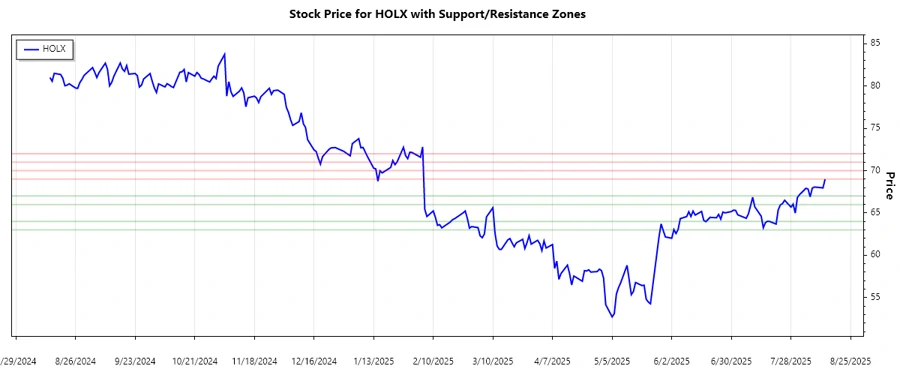
Analysis of HOLX's price levels indicates the following key zones:
| Zone Type | From ($) | To ($) |
|---|---|---|
| Support | 63.0 | 64.0 |
| Support | 66.0 | 67.0 |
| Resistance | 69.0 | 70.0 |
| Resistance | 71.0 | 72.0 |
Currently, HOLX trades amidst these zones, with the price operating below the primary resistance of $69-$70 range. Should it breach the first resistance, the stock could potentially rally towards the $71-$72 mark.
Conclusion
Overall, Hologic, Inc. exhibits a cautiously positive outlook. With recent upward trends and resistance challenges, prudent observation is warranted. Should the bullish signals persist, traders might find opportunities to leverage short-term gains. Nevertheless, cautious approach is advised amidst market volatility. Key support and resistance thresholds must be monitored closely to steer informed trading decisions.
Smart Data Insight
Master the Perfect Entry & Exit for this Stock
Don't leave your profits to chance. Historically, this stock follows specific seasonal patterns that institutional traders use to maximize returns.
- ✅ Identify the "Golden Buying Window"
- ✅ Avoid high-risk correction cycles
- ✅ Backtested data from the last 20+ years