June 20, 2025 a 08:15 am


HOLX: Trend and Support & Resistance Analysis - Hologic, Inc.
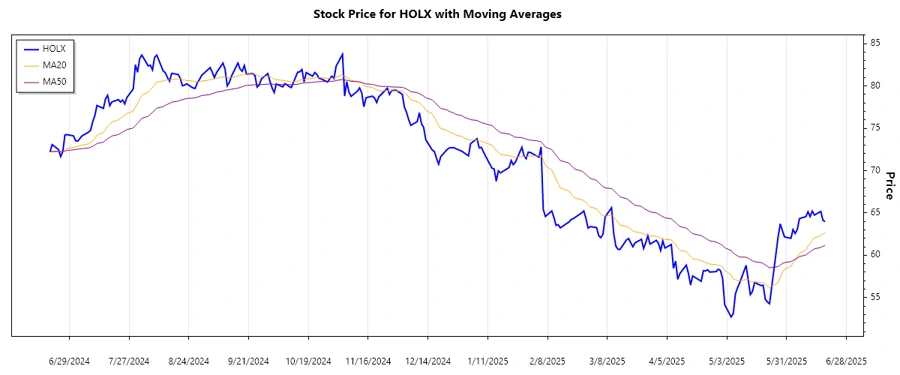
Hologic, Inc. has shown notable fluctuations in its stock price over the past few months. Engaged in women's health diagnostics and treatment, its fundamentals are supported by a wide range of products. Investors should consider both the short-term technical trends and the longer-term growth potential based on the company's product expansion and market reach. The following analysis delves into the latest stock trends and identifies key support and resistance levels.
Trend Analysis
The current trend analysis of Hologic, Inc. reveals a predominant downward movement in recent sessions. Calculating the Exponential Moving Averages, EMA20 is currently lower than EMA50, indicating a ▼ Abwärtstrend (downtrend).
| Date | Closing Price | Trend |
|---|---|---|
| 2025-06-18 | $63.97 | ▼ |
| 2025-06-17 | $64.14 | ▼ |
| 2025-06-16 | $65.18 | ▲ |
| 2025-06-13 | $64.75 | ▼ |
| 2025-06-12 | $65.22 | ▲ |
| 2025-06-11 | $64.58 | ▼ |
| 2025-06-10 | $65.14 | ▲ |
In conclusion, the data suggests a continuation of the downtrend with occasional upward corrections. Investors should be cautious and monitor potential trend reversals closely.
Support and Resistance
Analyzing the support and resistance levels, the recent data indicates:
| Support Zone | Resistance Zone |
|---|---|
| $54.00 - $56.00 | $65.00 - $67.00 |
| $62.00 - $64.00 | $68.00 - $70.00 |
The stock is currently within the $62.00 - $64.00 support zone, indicating potential price stabilization or reversal. Investors should watch for confirmation of price movements outside these zones.
Conclusion
Hologic, Inc. is experiencing a downtrend with stock prices moving within established support zones. While short-term technical indicators suggest caution, the company’s robust product line in diagnostics and women's health offers growth potential. Investors should balance technical data with fundamental analysis to make informed decisions. Potential risks include breaking below support levels, whereas a breach above resistance might signal an opportunity for bullish positions.
Smart Data Insight
Master the Perfect Entry & Exit for this Stock
Don't leave your profits to chance. Historically, this stock follows specific seasonal patterns that institutional traders use to maximize returns.
- ✅ Identify the "Golden Buying Window"
- ✅ Avoid high-risk correction cycles
- ✅ Backtested data from the last 20+ years