September 01, 2025 a 05:15 am
HOLX: Fibonacci Analysis - Hologic, Inc.
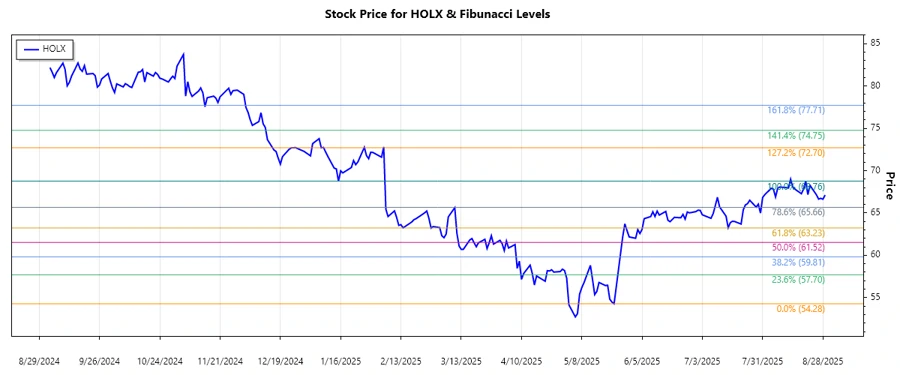
Hologic, Inc., an innovator in women's health, has shown resilience in the market with a recent significant upward trend. Known for its robust diagnostic and imaging systems, Hologic's stock has been on an upward trajectory, reflecting investor confidence and growth potential. The following Fibonacci analysis provides insights into possible future price movements and key levels to watch.
Fibonacci Analysis
| Metric | Details |
|---|---|
| Start Date of Trend | 2025-05-23 |
| End Date of Trend | 2025-08-20 |
| High Price | $68.76 (2025-08-20) |
| Low Price | $54.28 (2025-05-23) |
| Current Price | $67.12 |
| Fibonacci Levels |
|
| Retracement Zone | None |
| Interpretation | The stock price is above the Fibonacci levels, indicative of recent strength. There might be strong support around the $61.23 and $61.52 levels. |
Conclusion
The upward movement of Hologic's stock price signifies strong market confidence, likely driven by its strategic innovations and market expansion. A breakout beyond the upper Fibonacci levels suggests potential for further growth, yet investors should be cautious of possible profit-taking. The near-term prospects appear promising, with key support levels likely to provide stability. Analysts should continue to monitor for any shifts in market sentiment or external factors that might influence the stock's direction.
Smart Data Insight
Master the Perfect Entry & Exit for this Stock
Don't leave your profits to chance. Historically, this stock follows specific seasonal patterns that institutional traders use to maximize returns.
- ✅ Identify the "Golden Buying Window"
- ✅ Avoid high-risk correction cycles
- ✅ Backtested data from the last 20+ years