February 03, 2026 a 02:03 pm
HII: Trend and Support & Resistance Analysis - Huntington Ingalls Industries, Inc.
Huntington Ingalls Industries, Inc., a key player in military shipbuilding, has shown resilience in its stock movements. The company's diversified portfolio in nuclear and non-nuclear ships for the U.S. Navy and Coast Guard offers a buffer against market volatility. Despite recent fluctuations, the stock shows potential upward momentum. Investors should watch support and resistance levels closely to gauge future movements.
Trend Analysis
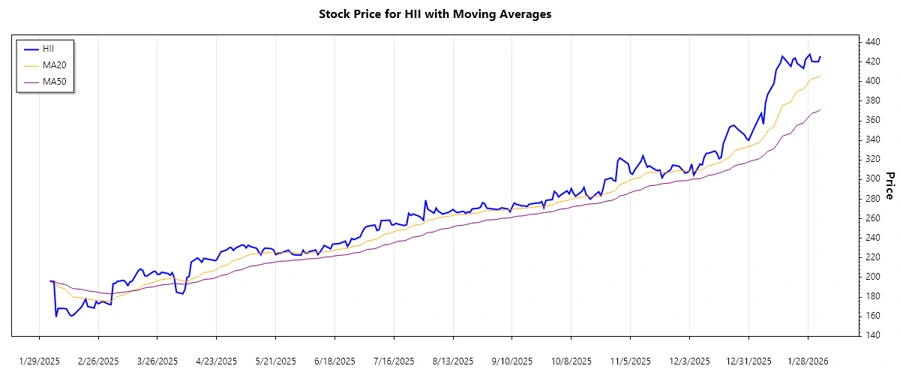
Analyzing the past data for HII, we observe important trends based on the EMA20 and EMA50. The data over the past months suggests a significant movement in the stock prices.
| Date | Closing Price | Trend |
|---|---|---|
| 2026-02-03 | 426.16 | ▲ Up |
| 2026-02-02 | 420.30 | ▲ Up |
| 2026-01-30 | 420.51 | ▲ Up |
| 2026-01-29 | 427.83 | ▲ Up |
| 2026-01-28 | 425.39 | ▲ Up |
| 2026-01-27 | 422.79 | ▲ Up |
| 2026-01-26 | 413.56 | ▲ Up |
Overall, the EMA analysis indicates a robust upward trajectory, signaling potential bullish sentiment among investors.
Support and Resistance
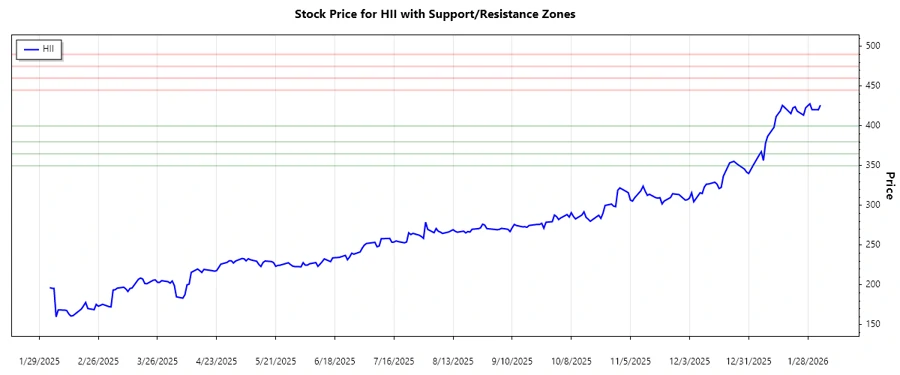
The following table outlines the identified support and resistance zones for HII.
| Zone Type | From | To | |
|---|---|---|---|
| Support | 380.00 | 400.00 | ▼ |
| Support | 350.00 | 365.00 | ▼ |
| Resistance | 445.00 | 460.00 | ▲ |
| Resistance | 475.00 | 490.00 | ▲ |
The current price appears to be approaching a resistance zone, suggesting potential profit-taking or consolidation in the near term.
Conclusion
Huntington Ingalls Industries, Inc. exhibits a positive outlook with its stock in a confirmed uptrend as indicated by the EMA20 crossing above the EMA50. While the stock nears its resistance zones, bullish momentum remains strong. Investors should exercise caution and monitor how the stock behaves around these critical levels. The support levels provide a safety net, making it a favorable buy on pullbacks. Risk management remains crucial, particularly in volatile market conditions.