June 20, 2026 a 07:43 am

HII: Fundamental Ratio Analysis - Huntington Ingalls Industries, Inc.
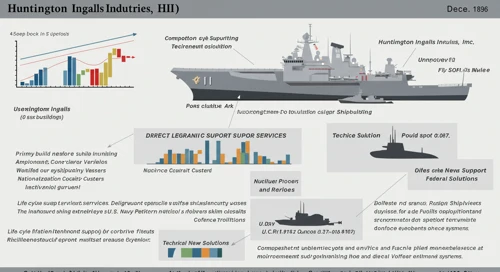
Huntington Ingalls Industries, Inc. (HII) remains a robust player in the defense sector with consistent performance across various segments. The company offers strong potential with its solid foundation in naval and defense technologies, vital to U.S. military infrastructure.
Fundamental Rating
The fundamental analysis showcases a stable yet moderately positive outlook for HII, with room for improvement in financial leverage ratios.
| Category | Score | Visualization |
|---|---|---|
| Discounted Cash Flow | 5 | |
| Return on Equity | 4 | |
| Return on Assets | 4 | |
| Debt to Equity | 2 | |
| Price to Earnings | 2 | |
| Price to Book | 2 |
Historical Rating
The historical rating data not only reinforces current scores but also highlights stable performance consistency over recent periods.
| Date | Overall | DCF | ROE | ROA | Debt/Equity | P/E | P/B |
|---|---|---|---|---|---|---|---|
| 2026-06-18 | 3 | 5 | 4 | 4 | 2 | 2 | 2 |
| Previous Date Unavailable | 0 | 5 | 4 | 4 | 2 | 2 | 2 |
Analyst Price Targets
Analyst projections suggest stable growth outlook for HII, with price targets reflecting moderate confidence within current market conditions.
| High | Low | Median | Consensus |
|---|---|---|---|
| $421 | $419 | $420 | $420 |
Analyst Sentiment
The analyst sentiment for HII reflects a collective hold strategy, emphasizing the need to watch for potential shifts in the operational landscape or financial performance.
| Recommendation | Count | Visualization |
|---|---|---|
| Strong Buy | 0 | |
| Buy | 12 | |
| Hold | 14 | |
| Sell | 1 | |
| Strong Sell | 0 |
Conclusion
Huntington Ingalls Industries demonstrates a solid foundation in naval and defense operations, with consistent financial metrics suggesting a degree of resilience in fluctuating markets. However, there exists room for growth, particularly in improving financial leverage. The stock's analytical consensus reveals a hold position, reflecting cautious optimism amidst economic variables and competitive pressures. Investors should monitor the sector for macroeconomic changes that could sway HII's strategic positioning. Overall, while stable, potential investors should consider both risks and rewards in light of evolving defense needs.
Smart Data Insight
Master the Perfect Entry & Exit for this Stock
Don't leave your profits to chance. Historically, this stock follows specific seasonal patterns that institutional traders use to maximize returns.
- ✅ Identify the "Golden Buying Window"
- ✅ Avoid high-risk correction cycles
- ✅ Backtested data from the last 20+ years