
May 28, 2026 a 05:15 am
HII: Fibonacci Analysis - Huntington Ingalls Industries, Inc.
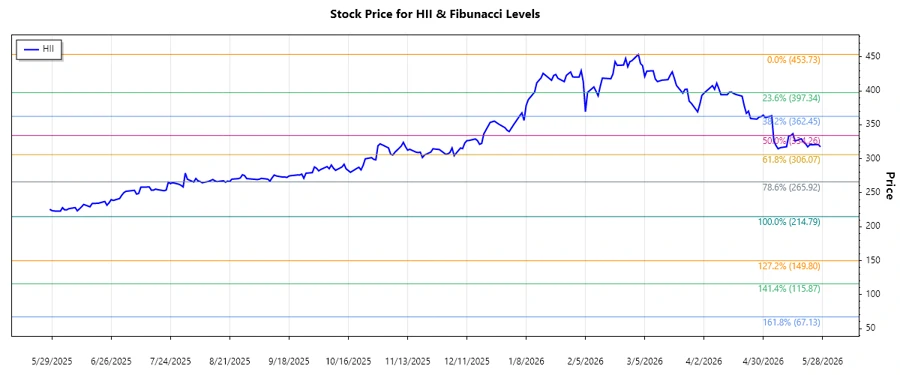
Huntington Ingalls Industries, Inc. (HII) has experienced significant price movement over the last few months. In the latest phase, the stock has been in a downtrend. The shift presents unique opportunities for potential investors as retracement levels may indicate key areas for reversals or continuation of the trend. However, market participants should remain vigilant of potential resistance and support levels.
Fibonacci Analysis
| Parameter | Details |
|---|---|
| Trend Start Date | 2025-08-28 |
| Trend End Date | 2026-05-27 |
| High Price & Date | $453.73 on 2026-03-02 |
| Low Price & Date | $214.79 on 2025-07-29 |
| Fibonacci Retracement Levels |
|
| Current Price | $317.56 |
| Retracement Zone | 0.618 |
| Technical Interpretation | The current price is in the 0.618 retracement zone, which may indicate a strong support level. This could either be a point of reversal or indicate continued selling pressure if breached. |
Conclusion
Huntington Ingalls Industries (HII) appears to be positioned at a critical juncture, trading at the significant 0.618 Fibonacci retracement level. This level often acts as a strong support, suggesting potential for price stabilization or even reversal. However, if selling pressure increases and this level is breached, further downside could be anticipated. For investors and traders, this presents a double-edged sword: a potential buying opportunity at support, countered by the risk of further declines. Carefully analyzing volume and other market conditions will be essential in assessing the next move for HII.
Smart Data Insight
Master the Perfect Entry & Exit for this Stock
Don't leave your profits to chance. Historically, this stock follows specific seasonal patterns that institutional traders use to maximize returns.
- ✅ Identify the "Golden Buying Window"
- ✅ Avoid high-risk correction cycles
- ✅ Backtested data from the last 20+ years