August 16, 2025 a 04:03 am


HIG: Trend and Support & Resistance Analysis - The Hartford Financial Services Group, Inc.
The Hartford Financial Services Group, Inc. (HIG) operates within a robust business environment, providing a comprehensive range of insurance and financial services globally. With its diverse portfolio, HIG shows significant potential for growth, yet faces challenges due to market fluctuations. The current analysis aims to offer insight into the stock's recent performance, considering key technical indicators like EMA and support and resistance zones. Investors should evaluate the alignment of HIG's strategic operations with market trends to gauge future performance.
Trend Analysis
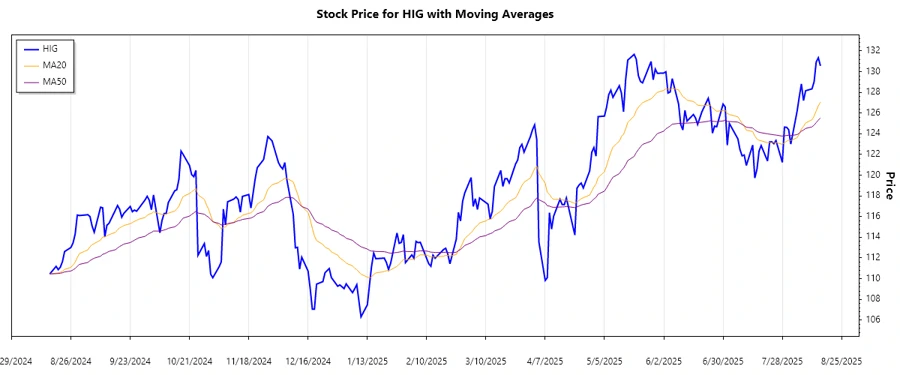
The technical analysis of HIG shows a generally positive trend over the analyzed period. By calculating the EMA20 and EMA50 from closing prices, we determine the prevailing trend.
| Date | Close Price | Trend |
|---|---|---|
| 2025-08-15 | 130.56 | ▲ Uptrend |
| 2025-08-14 | 131.34 | ▲ Uptrend |
| 2025-08-13 | 130.94 | ▲ Uptrend |
| 2025-08-12 | 129.02 | ▲ Uptrend |
| 2025-08-11 | 128.34 | ▲ Uptrend |
| 2025-08-08 | 128.16 | ▲ Uptrend |
| 2025-08-07 | 127.21 | ▲ Uptrend |
Based on the EMAs, HIG is in an uptrend phase, indicating potential bullish sentiment in the market. The consistent price increase in conjunction with the EMAs suggests a strong bullish position.
Support and Resistance
Upon examining the data, we identified significant support and resistance zones that could guide future price movements for HIG.
| Zone Type | From | To |
|---|---|---|
| Support Zone 1 | 124.00 | 126.00 |
| Support Zone 2 | 118.00 | 120.00 |
| Resistance Zone 1 | 130.00 | 132.00 |
| Resistance Zone 2 | 134.00 | 136.00 |
The current price is nearing the first resistance zone. Should it breach this level, additional gains could follow. Conversely, a retracement to support levels might occur if price resistance proves strong.
Conclusion
In conclusion, HIG appears to be in a generally favorable trading position with more support from the trend indicators. The presence of nearby resistance highlights potential price ceilings; however, breaking them could yield considerable growth. For investors watching HIG, focusing on how these resistance levels hold is crucial. Analyzing both fundamental market conditions and technical data will be vital in anticipating future performance. The balance between risk and opportunity seems aligned with potential gains surrounding a bullish market sentiment.
Smart Data Insight
Master the Perfect Entry & Exit for this Stock
Don't leave your profits to chance. Historically, this stock follows specific seasonal patterns that institutional traders use to maximize returns.
- ✅ Identify the "Golden Buying Window"
- ✅ Avoid high-risk correction cycles
- ✅ Backtested data from the last 20+ years