February 13, 2026 a 05:15 am**HIG: Fibonacci Analysis - The Hartford Financial Services Group, Inc.**
 **Fibonacci Analysis**
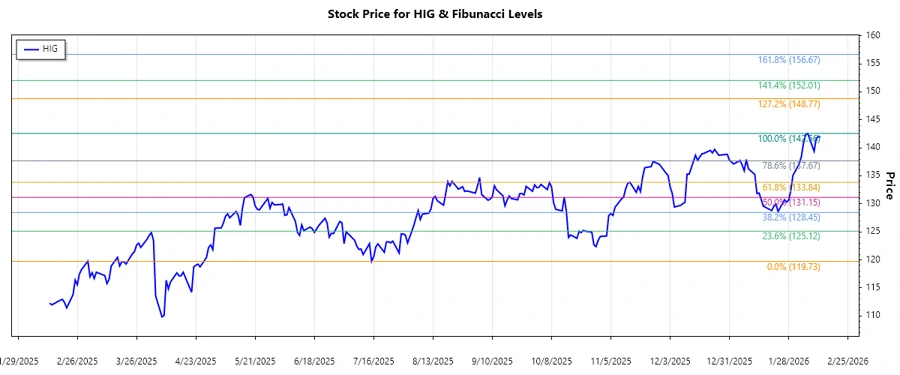
Based on the analysis of price data from July 2025 to February 2026, the dominant trend is an upward trend.
**Detailed Analysis:**
**Fibonacci Analysis**
Based on the analysis of price data from July 2025 to February 2026, the dominant trend is an upward trend.
**Detailed Analysis:**
 **Conclusion**
The Hartford Financial Services Group, Inc. stock exhibits a strong upward trend, with investor interest likely driven by the company's comprehensive product portfolio and stable market position. The current price is above the major Fibonacci levels, indicating that there is continued investor optimism.
Given this technical analysis, the stock appears well-positioned to benefit from ongoing positive momentum. However, market participants should remain vigilant about potential market shifts that could impact the company's performance. With robust support levels identified via Fibonacci retracement, investors have guidance on potential entry and exit points for maximizing returns while managing risk exposure effectively.
**Conclusion**
The Hartford Financial Services Group, Inc. stock exhibits a strong upward trend, with investor interest likely driven by the company's comprehensive product portfolio and stable market position. The current price is above the major Fibonacci levels, indicating that there is continued investor optimism.
Given this technical analysis, the stock appears well-positioned to benefit from ongoing positive momentum. However, market participants should remain vigilant about potential market shifts that could impact the company's performance. With robust support levels identified via Fibonacci retracement, investors have guidance on potential entry and exit points for maximizing returns while managing risk exposure effectively.
The Hartford Financial Services Group, Inc. (HIG) has shown a robust upward trajectory from July 2025 to February 2026, indicative of investor confidence in its diversified offerings and strategic positioning in the insurance and financial services sectors. This uptrend suggests a positive sentiment among market participants, potentially fueled by the company's strong financial performance and stability. As we undertake a Fibonacci analysis, key retracement levels will help indicate potential support and resistance areas, essential for making informed investment decisions.
| Detail | Value |
|---|---|
| Trend Start Date | July 15, 2025 |
| Trend End Date | February 12, 2026 |
| High Point (Price & Date) | $142.56 on February 6, 2026 |
| Low Point (Price & Date) | $119.73 on July 15, 2025 |
| Fibonacci - 0.236 | $133.28 |
| Fibonacci - 0.382 | $129.95 |
| Fibonacci - 0.5 | $131.15 |
| Fibonacci - 0.618 | $134.92 |
| Fibonacci - 0.786 | $138.18 |
| Current Price | $141.89 on February 12, 2026 |
| Retracement Zone | None |
| Technical Interpretation | The price remains above the 0.786 level, suggesting strong bullish momentum and potential support around $138.18. |
**Conclusion**
The Hartford Financial Services Group, Inc. stock exhibits a strong upward trend, with investor interest likely driven by the company's comprehensive product portfolio and stable market position. The current price is above the major Fibonacci levels, indicating that there is continued investor optimism.
Given this technical analysis, the stock appears well-positioned to benefit from ongoing positive momentum. However, market participants should remain vigilant about potential market shifts that could impact the company's performance. With robust support levels identified via Fibonacci retracement, investors have guidance on potential entry and exit points for maximizing returns while managing risk exposure effectively.