September 20, 2025 a 10:15 am
HIG: Fibonacci Analysis - The Hartford Financial Services Group, Inc.
The Hartford Financial Services Group, Inc. has shown a steady growth in its stock price over the past months, marking a significant uptrend. The company’s diverse offerings in the insurance and financial services sectors contribute to its robust performance. Technical analysis indicates potential support and resistance levels that investors should be mindful of in the near future.
Fibonacci Analysis
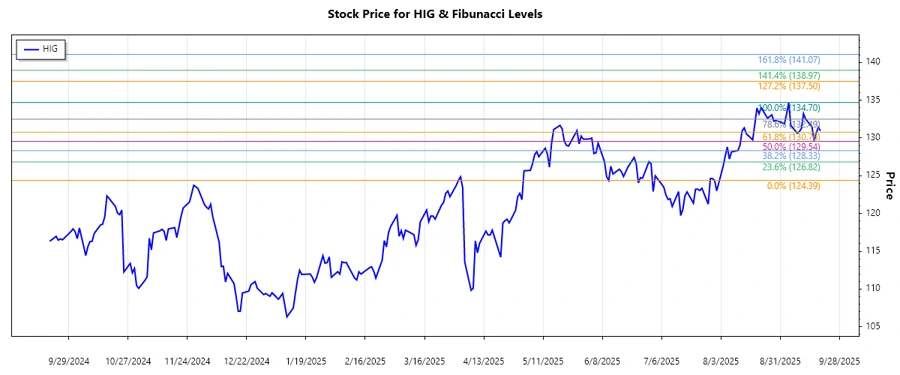
The analysis focuses on the uptrend from early April 2025 to mid-September 2025. This assessment identifies the highest point on September 4, 2025, at a price of $134.70, and the lowest point on April 1, 2025, at a price of $124.39. Fibonacci retracement levels have been calculated to identify potential support and resistance levels.
| Parameter | Description |
|---|---|
| Start Date | 2025-04-01 |
| End Date | 2025-09-04 |
| High | $134.70 (2025-09-04) |
| Low | $124.39 (2025-04-01) |
| Fibonacci Levels |
|
| Current Price | $130.95 (2025-09-19) |
| Retracement Zone | 0.382 |
| Technical Interpretation | The current price is within the 0.382 retracement level, suggesting a moderate pullback. This level can act as a support zone if the price consolidates here. |
Conclusion
The Hartford Financial Services Group, Inc. has witnessed an ascending trajectory in the stock market. The recent retracement levels suggest that the stock is likely to find support around the current price. However, any breach below these levels could prompt further downward adjustments, posing a risk to investors. The company’s strong market position and diverse portfolio offer potential for a rebound, but investors should be cautious of market volatility. The analysis further advises monitoring these technical indicators closely for better decision-making.
Smart Data Insight
Master the Perfect Entry & Exit for this Stock
Don't leave your profits to chance. Historically, this stock follows specific seasonal patterns that institutional traders use to maximize returns.
- ✅ Identify the "Golden Buying Window"
- ✅ Avoid high-risk correction cycles
- ✅ Backtested data from the last 20+ years