August 31, 2025 a 10:15 am

HIG: Fibonacci Analysis - The Hartford Financial Services Group, Inc.
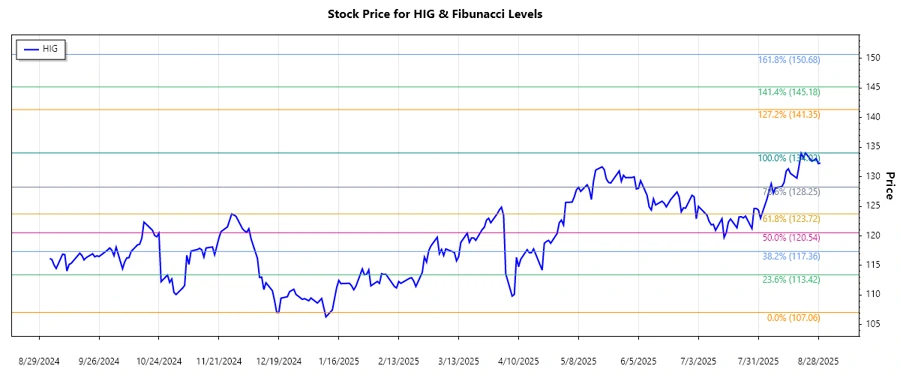
The Hartford Financial Services Group, Inc. stock has shown considerable resilience in the recent months, evidenced by an upward trend spanning several months. This upward movement indicates increasing investor confidence. Utilizing Fibonacci retracement analysis can provide insights into potential support and resistance levels. Such an analysis can aid in making well-informed investment decisions.
Fibonacci Analysis
| Attribute | Details |
|---|---|
| Trend Type | Upward |
| Start Date | 2024-12-19 |
| End Date | 2025-08-27 |
| High Price & Date | $134.02 on 2025-08-22 |
| Low Price & Date | $107.06 on 2024-12-19 |
| 0.236 Fibonacci Level | $112.94 |
| 0.382 Fibonacci Level | $117.50 |
| 0.5 Fibonacci Level | $120.54 |
| 0.618 Fibonacci Level | $123.58 |
| 0.786 Fibonacci Level | $127.85 |
| Current Price | $132.31 |
| Retracement Zone | None |
| Interpretation | The current price is above the highest Fibonacci level, indicating ongoing upward momentum. The stock may face challenges in maintaining this trend long-term; however, it is currently in a strong position. |
Conclusion
The stock of The Hartford Financial Services Group, Inc. demonstrates a solid upward trajectory, having breached its key Fibonacci levels. This momentum can signify strong ongoing investor interest, with potential future growth. However, it is crucial for investors to be mindful of market volatility and possible retracement. Analysts should watch for any new developments that might affect the stock, as market conditions remain dynamic. Proper risk management practices are advisable for investors at this juncture.
Smart Data Insight
Master the Perfect Entry & Exit for this Stock
Don't leave your profits to chance. Historically, this stock follows specific seasonal patterns that institutional traders use to maximize returns.
- ✅ Identify the "Golden Buying Window"
- ✅ Avoid high-risk correction cycles
- ✅ Backtested data from the last 20+ years