
July 01, 2026 a 03:31 pm

HIG: Dividend Analysis - The Hartford Insurance Group, Inc.
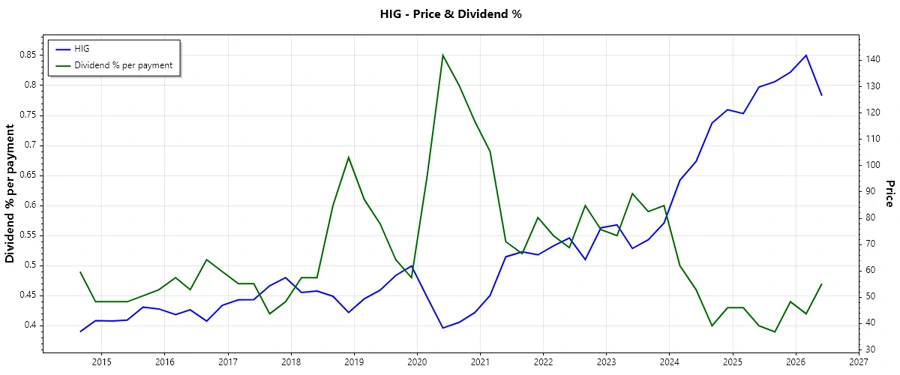
The Hartford Insurance Group, Inc. displays a well-structured dividend payment plan, characterized by low payout ratios and a stable growth trajectory. The firm's current dividend yield, although modest, aligns with its long history of uninterrupted distributions, showcasing reliability and shareholder commitment. With a strategic focus on sustaining cash flow and minimizing debt, HIG stands resilient in uncertain market conditions.
📊 Overview
The Hartford Insurance Group's dividend profile reflects its commitment to shareholder returns, demonstrating stability and systematic growth over decades. HIG operates in the insurance sector with a current dividend yield of 1.83%, offering a steady income stream despite market volatility. The company has a remarkable track record with 31 years of dividend history and no recent cuts or suspensions, projecting confidence to long-term investors.
| Parameter | Value |
|---|---|
| Sector | Insurance |
| Dividend yield | 1.83% |
| Current dividend per share | 2.17 USD |
| Dividend history | 31 years |
| Last cut or suspension | None |
🗣️ Dividend History
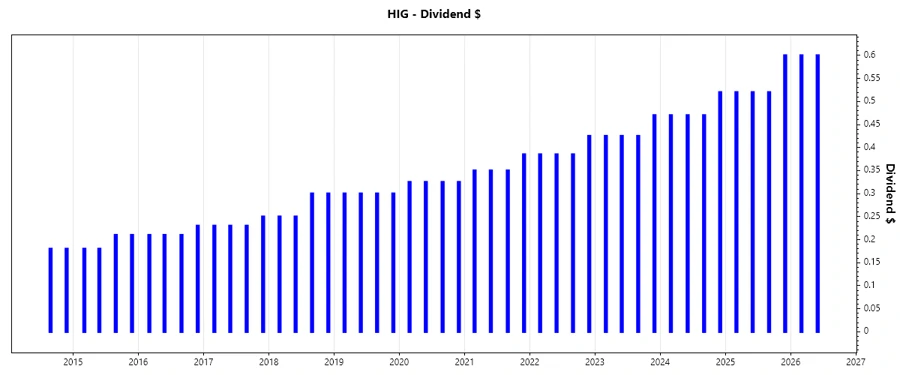
Reviewing the dividend history is crucial for investors seeking long-term reliability. A consistent upward payment trend offers stability, reflecting effective cash management. In times of economic uncertainty, past payment consistency can signify financial resilience.
| Year | Dividend Per Share (USD) |
|---|---|
| 2026 | 1.20 |
| 2025 | 2.16 |
| 2024 | 1.93 |
| 2023 | 1.745 |
| 2022 | 1.58 |
📈 Dividend Growth
Understanding dividend growth can provide insights into future income potential. The Hartford's dividend growth over the last 3 and 5 years displays a consistent pattern, key for assessing long-term dividend sustainability.
| Time | Growth |
|---|---|
| 3 years | 10.99% |
| 5 years | 10.69% |
The average dividend growth is 10.69% over 5 years. This shows moderate but steady dividend growth, signifying a well-managed increase strategy to ensure shareholder value.
📉 Payout Ratio
The payout ratio is crucial to evaluate the sustainability of a company's dividend policy. HIG's low payout ratios indicate a well-balanced strategy between rewarding shareholders and reinvesting earnings for growth.
| Key figure | Ratio |
|---|---|
| EPS-based | 14.87% |
| Free cash flow-based | 10.22% |
A payout ratio of 14.87% (EPS) and 10.22% (FCF) suggests The Hartford is maintaining a conservative dividend policy, providing a cushion against potential earnings volatility.
✅ Cashflow & Capital Efficiency
A thorough analysis of cash flow and capital efficiency reveals the true financial health of an enterprise. HIG exhibits robust cash flow management and capital efficiency metrics, crucial for sustaining dividend payouts and funding future operations.
| Year | 2025 | 2024 | 2023 |
|---|---|---|---|
| Free Cash Flow Yield | 14.78% | 17.93% | 16.22% |
| Earnings Yield | 9.86% | 9.68% | 10.14% |
| CAPEX to Operating Cash Flow | 2.85% | 2.45% | 5.09% |
| Stock-based Compensation to Revenue | 0.00% | 0.00% | 0.00% |
| Free Cash Flow / Operating Cash Flow Ratio | 97.15% | 97.54% | 94.90% |
With a consistently high Free Cash Flow Yield and prudent CAPEX management, HIG demonstrates superb capital efficiency, underscoring its financial resiliency and capacity to honor its dividend promises.
⚠️ Balance Sheet & Leverage Analysis
The balance sheet provides insights into a company's financial structure and risk exposure. The ratios indicate HIG's strong financial foundation, maintaining low leverage while ensuring operational liquidity.
| Year | 2025 | 2024 | 2023 |
|---|---|---|---|
| Debt-to-Equity | 23.03% | 26.55% | 28.46% |
| Debt-to-Assets | 5.08% | 5.40% | 6.22% |
| Debt-to-Capital | 18.72% | 20.98% | 22.15% |
| Net Debt to EBITDA | 0.79 | 0.99 | 1.18 |
| Current Ratio | 17.65 | 16.69 | 0.33 |
| Quick Ratio | 17.65 | 16.69 | 0.33 |
| Financial Leverage | 4.53 | 4.92 | 4.57 |
The Hartford's leverage ratios indicate prudent financial management with a commitment to minimizing debt obligations, thereby safeguarding its capacity to reinvest for future growth and stability.
✅ Fundamental Strength & Profitability
A company's fundamental strength is a gauge of its profitability and operational efficiency. The Hartford's robust returns on equity and diverse margin profiles underscore its superior profitability framework.
| Year | 2025 | 2024 | 2023 |
|---|---|---|---|
| Return on Equity | 20.21% | 18.92% | 16.34% |
| Return on Assets | 4.46% | 3.84% | 3.57% |
| Margins: Net | 13.57% | 11.79% | 10.29% |
| EBIT | 17.55% | 14.59% | 12.69% |
| EBITDA | 18.95% | 15.94% | 14.79% |
| Gross | 46.08% | 15.05% | 13.02% |
| Research & Development to Revenue | 0% | 0% | 0% |
The Hartford exemplifies exceptional profitability through consistent margin improvements and strategic asset investments, signaling robust operational strategies.
📉 Price Development
📊 Dividend Scoring System
The following criteria evaluate the dividend profile and financial health of The Hartford Insurance Group:
| Criteria | Score | Rating |
|---|---|---|
| Dividend yield | 3 | |
| Dividend Stability | 5 | |
| Dividend growth | 4 | |
| Payout ratio | 5 | |
| Financial stability | 5 | |
| Dividend continuity | 5 | |
| Cashflow Coverage | 4 | |
| Balance Sheet Quality | 5 |
Total Score: 36/40
🗣️ Rating
The Hartford Insurance Group, Inc. demonstrates a strong and reliable dividend performance, supported by a robust financial foundation and consistent profitability. The firm is well-positioned for future growth and shareholder value delivery, marking it as a prudent choice for income-focused investors seeking both yield and stability.
Smart Data Insight
Master the Perfect Entry & Exit for this Stock
Don't leave your profits to chance. Historically, this stock follows specific seasonal patterns that institutional traders use to maximize returns.
- ✅ Identify the "Golden Buying Window"
- ✅ Avoid high-risk correction cycles
- ✅ Backtested data from the last 20+ years