May 07, 2026 a 07:46 am


HIG: Dividend Analysis - The Hartford Financial Services Group, Inc.
The Hartford Financial Services Group, Inc. demonstrates a robust dividend profile with a consistent history of payments over the past 31 years. The company shows a steady dividend growth rate and maintains a healthy payout ratio, indicating effective and sustainable distributions to shareholders.
📊 Overview
| Sector | Dividend Yield | Current Dividend per Share | Dividend History | Last Cut or Suspension |
|---|---|---|---|---|
| Financials | 1.58% | 2.17 USD | 31 years | None |
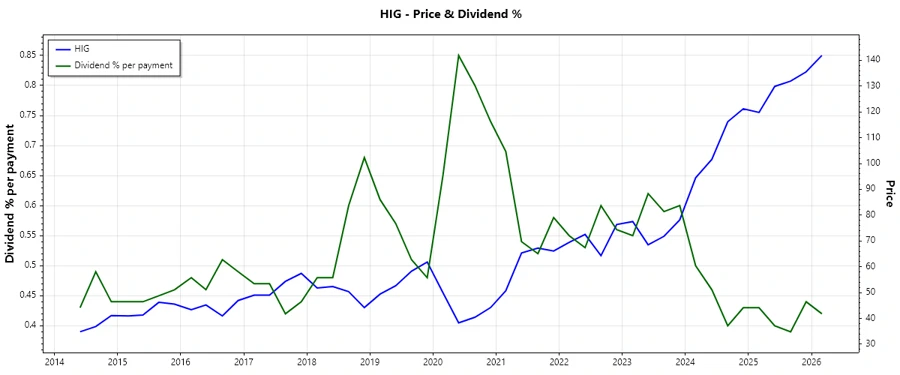
📈 Dividend History
The Hartford's consistent payment track is a key indicator of its commitment to shareholders. Such a history often implies financial stability and business maturity.
Chart displaying the dividend history over the past years.
| Year | Dividend Per Share |
|---|---|
| 2026 | 0.60 |
| 2025 | 2.16 |
| 2024 | 1.93 |
| 2023 | 1.745 |
| 2022 | 1.580 |
📉 Dividend Growth
Analyzing dividend growth is crucial to understanding potential future returns. Growth suggests a company's capability to enhance shareholder value.
| Time | Growth |
|---|---|
| 3 years | 10.99 % |
| 5 years | 10.69 % |
The average dividend growth is 10.69% over 5 years. This shows moderate but steady dividend growth.
Illustration of dividend growth over specified periods.
✅ Payout Ratio
Payout ratios underscore a company's ability to manage dividend payments without compromising financial health.
| Key Figure | Ratio |
|---|---|
| EPS-based | 14.87% |
| Free Cash Flow-based | 10.22% |
The EPS-based payout ratio of 14.87% and a cash flow-based ratio of 10.22% indicate a comfortable coverage of dividends, pointing to sound financial management.
🗣️ Cashflow & Capital Efficiency
A firm's cash flow underpins its ability to sustain operations and finance dividend policies. Efficient capital allocation drives growth.
| 2025 | 2024 | 2023 | |
|---|---|---|---|
| Free Cash Flow Yield | 14.78% | 17.93% | 16.22% |
| Earnings Yield | 9.86% | 9.68% | 10.14% |
| CAPEX to Operating Cash Flow | 2.71% | 2.45% | 5.09% |
| Stock-based Compensation to Revenue | 0.23% | 0% | 0% |
| Free Cash Flow / Operating Cash Flow Ratio | 97.15% | 97.54% | 94.91% |
The firm's solid free cash flow metrics highlight its ability to cover financial obligations and reinvest in growth efficiently.
⚠️ Balance Sheet & Leverage Analysis
A robust balance sheet and controlled leverage are critical for long-term financial stability and resilience.
| 2025 | 2024 | 2023 | |
|---|---|---|---|
| Debt-to-Equity | 23.03% | 26.55% | 28.46% |
| Debt-to-Assets | 5.08% | 5.40% | 6.23% |
| Debt-to-Capital | 18.72% | 20.98% | 22.15% |
| Net Debt to EBITDA | 0.75 | 0.99 | 1.18 |
| Current Ratio | 18.17 | 16.69 | 0.33 |
| Quick Ratio | 17.65 | 16.69 | 0.33 |
| Financial Leverage | 4.53 | 4.91 | 4.57 |
The Hartford maintains a prudent approach to its leverage, ensuring substantial liquidity and controlled debt levels.
📊 Fundamental Strength & Profitability
Strong fundamentals and profitability ratios are essential for evaluating business performance and forecasting future success.
| 2025 | 2024 | 2023 | |
|---|---|---|---|
| Return on Equity | 20.21% | 18.92% | 16.34% |
| Return on Assets | 4.46% | 3.84% | 3.57% |
| Net Margin | 13.57% | 11.79% | 10.29% |
| EBIT Margin | 17.55% | 14.59% | 12.69% |
| EBITDA Margin | 18.95% | 15.94% | 14.79% |
| Gross Margin | 46.08% | 15.05% | 13.02% |
| R&D to Revenue | 0% | 0% | 0% |
The metrics display resilient profitability with significant returns, supporting stable dividend prospects.
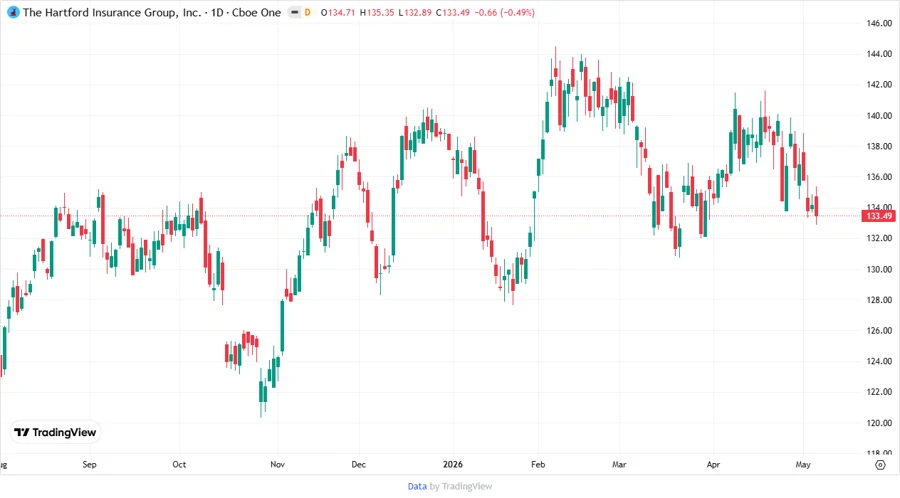
📈 Price Development
This chart visualizes the stock price development of The Hartford Financial Services Group, Inc.
⚖️ Dividend Scoring System
| Category | Score (1-5) | Score Bar |
|---|---|---|
| Dividend Yield | 4 | |
| Dividend Stability | 5 | |
| Dividend Growth | 3 | |
| Payout Ratio | 5 | |
| Financial Stability | 5 | |
| Dividend Continuity | 5 | |
| Cashflow Coverage | 4 | |
| Balance Sheet Quality | 5 |
Total Score: 36/40
Rating
The Hartford Financial Services Group, Inc. holds a commendable position with consistent dividend payouts and strong financial health, making it an attractive option for income-focused investors. The company maintains stability and growth, providing a solid foundation for dividend continuity in the future.
Smart Data Insight
Master the Perfect Entry & Exit for this Stock
Don't leave your profits to chance. Historically, this stock follows specific seasonal patterns that institutional traders use to maximize returns.
- ✅ Identify the "Golden Buying Window"
- ✅ Avoid high-risk correction cycles
- ✅ Backtested data from the last 20+ years