January 14, 2026 a 12:46 pm


HIG: Dividend Analysis - The Hartford Financial Services Group, Inc.
The Hartford Financial Services Group, Inc. demonstrates a strong dividend history with a consistent track of payments and growth over the years. With a moderate dividend yield and robust financial metrics, the company stands out as a resilient player in the financial services sector.
📊 Overview
The Hartford Financial Services Group, Inc., operating within the financial sector, presents a solid dividend profile backed by consistent distribution and financial resilience.
| Metric | Value |
|---|---|
| Sector | Financial Services |
| Dividend Yield | 1.59 % |
| Current Dividend per Share | 1.96 USD |
| Dividend History | 30 years |
| Last Cut or Suspension | 2009 |
📈 Dividend History
A persistent dividend distribution over 30 years showcases The Hartford's dedication to returning capital to shareholders, a critical attribute for dividend investors valuing stability and predictability.
| Year | Dividend per Share (USD) |
|---|---|
| 2025 | 2.16 |
| 2024 | 1.93 |
| 2023 | 1.745 |
| 2022 | 1.580 |
| 2021 | 1.435 |
📉 Dividend Growth
Steady dividend growth over recent years highlights the company's capability to increase shareholder value.
| Time | Growth |
|---|---|
| 3 years | 10.99 % |
| 5 years | 10.69 % |
The average dividend growth is 10.69 % over 5 years. This shows moderate but steady dividend growth.
🗣️ Payout Ratio
The payout ratio provides insight into the sustainability of dividend payments, with low to moderate figures suggesting less strain on financial resources.
| Key figure | Ratio |
|---|---|
| EPS-based | 15.50 % |
| Free cash flow-based | 9.29 % |
With an EPS payout ratio of 15.50% and a FCF payout ratio of 9.29%, the dividend is well covered, reflecting a stable dividend policy with room for growth.
✅ Cashflow & Capital Efficiency
Strong cash flow metrics and efficient capital utilization ensure the company can consistently meet its dividend commitments.
| Metric | 2024 | 2023 | 2022 |
|---|---|---|---|
| Free Cash Flow Yield | 17.93 % | 16.02 % | 15.56 % |
| Earnings Yield | 9.68 % | 10.02 % | 7.39 % |
| CAPEX to Operating Cash Flow | 1.62 % | 5.09 % | 4.37 % |
| Stock-based Compensation to Revenue | 0.23 % | 0.00 % | 0.00 % |
| Free Cash Flow / Operating Cash Flow Ratio | 97.55 % | 94.91 % | 95.63 % |
The firm's strong cash flow generation and capital discipline are indicative of potential to support future dividend growth and operational expansion.
⚠️ Balance Sheet & Leverage Analysis
Financial stability and liquidity are paramount for ensuring long-term dividend payments and corporate flexibility.
| Metric | 2024 | 2023 | 2022 |
|---|---|---|---|
| Debt-to-Equity | 26.55 % | 28.46 % | 31.96 % |
| Debt-to-Assets | 5.40 % | 6.22 % | 5.97 % |
| Debt-to-Capital | 20.98 % | 22.15 % | 24.22 % |
| Net Debt to EBITDA | 0.99 | 1.18 | 1.43 |
| Current Ratio | 17.79 | 0.33 | 24.79 |
| Quick Ratio | 16.69 | 0.33 | 24.79 |
| Financial Leverage | 4.92 | 4.57 | 5.36 |
The balance sheet exhibits strong liquidity and moderate leverage, which supports the company's risk profile and ability to sustain dividend distributions.
🗣️ Fundamental Strength & Profitability
High returns and efficient capital usage drive profitability, supporting ongoing operations and shareholder returns.
| Metric | 2024 | 2023 | 2022 |
|---|---|---|---|
| Return on Equity | 18.92 % | 16.34 % | 13.34 % |
| Return on Assets | 3.84 % | 3.57 % | 2.49 % |
| Margins: Net | 11.79 % | 10.29 % | 8.32 % |
| Margins: EBIT | 14.59 % | 12.69 % | 10.35 % |
| Margins: EBITDA | 15.94 % | 14.79 % | 13.21 % |
Strong performance and efficient use of resources highlight the company's capability to maintain profitability and deliver returns to shareholders.
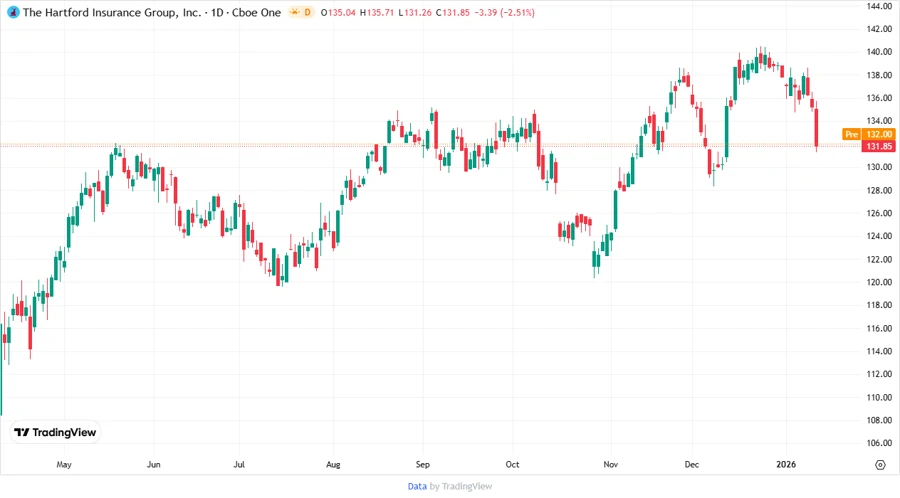
💹 Price Development
📊 Dividend Scoring System
| Criterion | Score | Score Bar |
|---|---|---|
| Dividend Yield | 3 | |
| Dividend Stability | 5 | |
| Dividend Growth | 4 | |
| Payout Ratio | 5 | |
| Financial Stability | 4 | |
| Dividend Continuity | 5 | |
| Cashflow Coverage | 5 | |
| Balance Sheet Quality | 5 |
Total Score: 36/40
🔍 Rating
The Hartford Financial Services Group, Inc. is rated as a robust choice for dividend investors seeking stability and moderate growth potential. Its solid financial position and exemplary dividend history underscore its capability to sustain dividend payments into the future.