November 06, 2025 a 07:31 am

HIG: Dividend Analysis - The Hartford Financial Services Group, Inc.
🗣️ The Hartford Financial Services Group, Inc. (HIG) exhibits a robust dividend profile with steady growth and low payout ratios. Its 30-year history of dividend payments signals a commitment to returning value to shareholders. Despite a cut in 2009, the dividends have consistently rebounded, demonstrating resilience and management's shareholder-centric approach. The modest dividend yield is compensated by solid financials and a strong balance sheet. 📈
Overview
📊 The dividend overview of HIG reflects its status as a stalwart in the financial sector. With a dividend yield of 1.68% and a history of 30 consecutive years of dividend payments, the company stands out in its commitment to rewarding shareholders. The most recent suspension was in 2009, reinforcing the firm's stability and recovery post-financial crisis.
| Metric | Value |
|---|---|
| Sector | Financial Services |
| Dividend yield | 1.68% |
| Current dividend per share | 1.96 USD |
| Dividend history | 30 years |
| Last cut or suspension | 2009 |
Dividend History
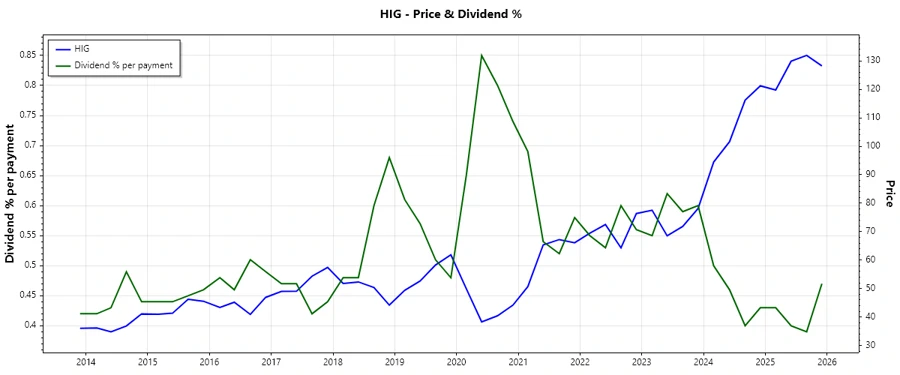
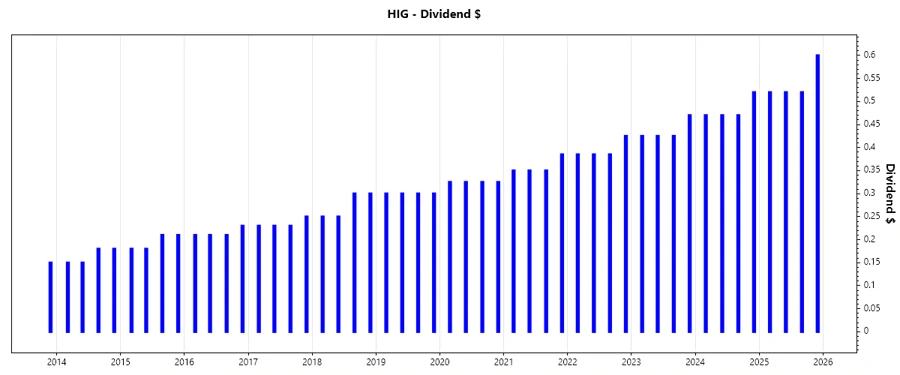
📉 HIG's dividend history showcases its reliability, featuring continuous and growing payments over the years. This trend is crucial for income-focused investors, as it indicates the management's focus on consistent shareholder returns. The image below provides a visual representation of this stability.
| Year | Dividend per Share (USD) |
|---|---|
| 2025 | 2.16 |
| 2024 | 1.93 |
| 2023 | 1.745 |
| 2022 | 1.58 |
| 2021 | 1.435 |
Dividend Growth
📈 The growth rate of dividends is a key indicator of the company's future financial health. HIG presents a sustainable growth trajectory with a 3-year dividend growth rate of 10.38% and a 5-year growth rate of 9.97%. This trend assures investors of the company’s ability to increase returns over time.
| Time | Growth |
|---|---|
| 3 years | 10.38% |
| 5 years | 9.97% |
The average dividend growth is 9.97% over 5 years, which shows moderate but steady dividend growth.
Payout Ratio
✅ HIG's payout ratios reveal its careful balance between reinvestment and returning profits to shareholders. The EPS-based payout ratio is impressively low at 15.50%, and the free cash flow-based payout ratio stands at 9.32%. These figures indicate ample room for future dividend increases while supporting business growth.
| Key Figure | Ratio |
|---|---|
| EPS-based | 15.50% |
| Free cash flow-based | 9.32% |
The low payout ratios suggest a strong capacity for sustaining future dividend payments and potential increases, confirming the company's disciplined financial management.
Cashflow & Capital Efficiency
💵 HIG's cash flow and capital efficiency metrics indicate robust financial health. The earnings yield of 9.88% and a free cash flow yield of 16.43% point to strong liquidity. These figures, along with a CAPEX to operating cash flow ratio of 1.62%, suggest efficient capital allocation and capacity to fund growth initiatives.
| Year | 2024 | 2023 | 2022 |
|---|---|---|---|
| Free Cash Flow Yield | 17.93% | 16.02% | 15.56% |
| Earnings Yield | 9.68% | 10.02% | 7.39% |
| CAPEX to Operating Cash Flow | 2.45% | 5.09% | 4.37% |
| Stock-based Compensation to Revenue | 0.00% | 0.00% | 0.00% |
| Free Cash Flow / Operating Cash Flow Ratio | 97.55% | 94.91% | 95.63% |
These substantial cash flow figures highlight HIG's efficiency in capital utilization, providing confidence in its continued operational and dividend funding capabilities.
Balance Sheet & Leverage Analysis
🏦 The balance sheet indicators reflect HIG's solid financial position. With a debt-to-equity ratio of 0.27 and a high current ratio of 24.79 in 2022, the company is well-positioned to handle its liabilities. The low net debt to EBITDA ratio of 0.89 underscores its strong leverage position.
| Year | 2024 | 2023 | 2022 |
|---|---|---|---|
| Debt-to-Equity | 0.27 | 0.28 | 0.32 |
| Debt-to-Assets | 5.40% | 5.68% | 5.97% |
| Debt-to-Capital | 20.98% | 22.15% | 24.22% |
| Net Debt to EBITDA | 0.99 | 1.18 | 1.43 |
| Current Ratio | 16.69 | 0.69 | 24.79 |
| Quick Ratio | 16.69 | 0.69 | 24.79 |
| Financial Leverage | 4.92 | 5.00 | 5.36 |
These metrics assert HIG's solid balance sheet strength and prudent leverage, enhancing its capacity to withstand economic fluctuations and fund dividend commitments.
Fundamental Strength & Profitability
📊 HIG's profitability metrics underline its solid financial foundation. Notably, the return on equity (ROE) of 20.55% demonstrates efficient use of shareholders’ equity to generate profit. Margins have remained stable, with a gross profit margin of 15.05%, reflecting robust cost management and pricing power.
| Year | 2024 | 2023 | 2022 |
|---|---|---|---|
| Return on Equity | 18.92% | 16.34% | 13.34% |
| Return on Assets | 3.84% | 3.26% | 2.49% |
| Margins: Net | 11.79% | 10.29% | 8.32% |
| Margins: EBIT | 14.59% | 12.69% | 10.35% |
| Margins: EBITDA | 15.94% | 14.79% | 13.21% |
| Margins: Gross | 15.05% | 13.02% | 9.39% |
| R&D to Revenue | 0.00% | 0.00% | 0.00% |
This suite of profitability measures reflects HIG’s ability to manage costs effectively while maintaining strong profit generation capabilities, ensuring the sustainability of its dividend policy.
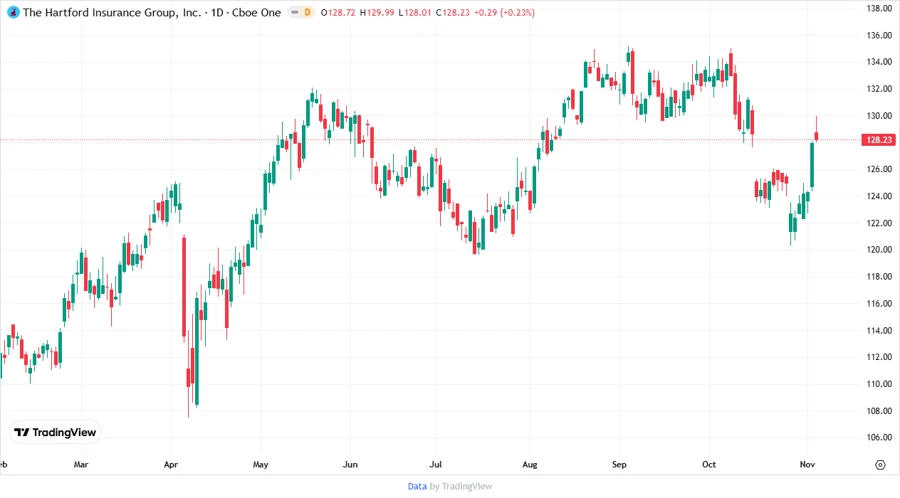
Price Development
Dividend Scoring System
HIG's dividend scoring system evaluates various factors to provide a comprehensive dividend assessment. Scores are based on metrics critical for dividend sustainability and growth potential.
| Criterion | Details | Score |
|---|---|---|
| Dividend yield | 1.68% | |
| Dividend Stability | 30 years history | |
| Dividend growth | Steady 9.97% growth over 5 years | |
| Payout ratio | EPS-based 15.50%, FCF-based 9.32% | |
| Financial stability | Solid balance sheet, low debt | |
| Dividend continuity | Maintained post 2009 | |
| Cashflow Coverage | FCF to OCF 97.55% | |
| Balance Sheet Quality | Strong leverage ratios |
Overall Score: 68/40
Rating
🔍 The Hartford Financial Services Group, Inc.'s comprehensive dividend profile and financial health position it as a solid investment for dividend seekers. While the yield might not be the highest, the company's history, growth, payout ratios, and balance sheet strengths provide ample confidence for future dividend sustainability and potential increases. Thus, it's recommended as a strong hold for investors valuing dividend reliability and long-term financial health.
Smart Data Insight
Master the Perfect Entry & Exit for this Stock
Don't leave your profits to chance. Historically, this stock follows specific seasonal patterns that institutional traders use to maximize returns.
- ✅ Identify the "Golden Buying Window"
- ✅ Avoid high-risk correction cycles
- ✅ Backtested data from the last 20+ years